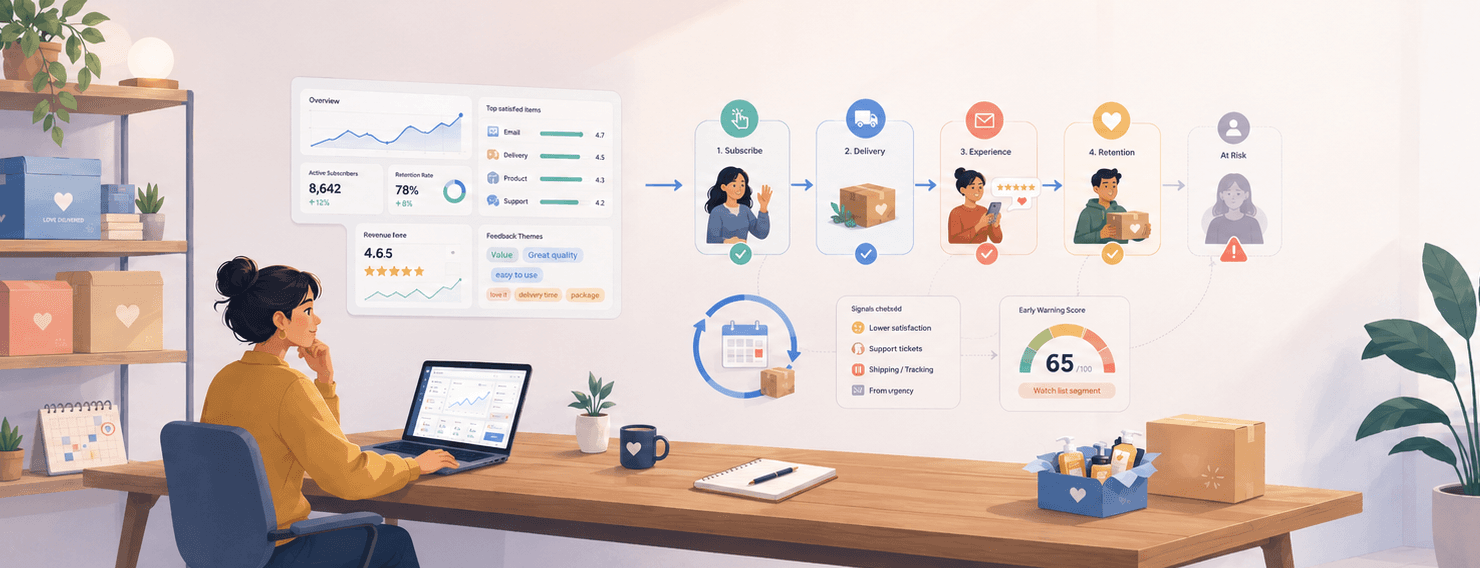



Your billing dashboard is very good at telling you that a subscriber has left. It is useless at telling you why.
By the time a cancellation shows up in your numbers, the decision was made weeks ago. The box that arrived a day late. The product that felt thinner on the third shipment than on the first. The two minutes someone spent hunting for a pause button that turned into a cancel. None of that is in your revenue report. All of it is in the experience, and the experience is the one thing most subscription brands never actually measure.
That gap matters more for subscription commerce than for any other model. A one-time buyer makes a single decision. A subscriber re-makes that decision every single billing cycle, and each cycle is a fresh chance to leave. So the question is not “how many subscribers did we lose,” it is “how do we see the loss coming while we can still do something about it.”
This guide is written for ecommerce and DTC subscription brands (subscription boxes, replenishment, memberships), not B2B SaaS. It walks through how to measure subscription customer experience as an early-warning system: which metrics to track, when to survey across the subscriber lifecycle, and how to turn that feedback into a churn signal you can act on before the cancel click.
Key Takeaways
- Churn is a lagging metric. It counts subscribers after they leave. To get ahead of it, you need leading indicators: NPS, CSAT, CES and cancellation-reason data collected throughout the subscription, not just at the exit.
- Voluntary and involuntary churn are different problems. Failed payments are a billing fix. Cancellations are an experience problem, and only feedback tells you what the experience got wrong.
- Some friction only shows up in the recurring relationship. In Retently’s ecommerce data, subscription pain was a top complaint for repeat buyers and absent among first-time buyers entirely. First-purchase metrics never catch it.
- Treat cancellation-reason surveys as structured research, not a coupon trigger. Aggregated and trended, they become a roadmap for product and operations.
- Map a metric to each stage of the subscriber journey, then route Detractors and rising-effort signals to a person who can intervene. Measurement without a closed loop is just a scoreboard.
Churn Is the Scoreboard, Not the Diagnosis
Most articles about subscription churn are written from inside a billing platform or a cancellation flow. They treat churn as a math problem (recover the failed payment) or an interception problem (catch the cancel and offer a discount). Both matter. Neither tells you what actually went wrong in the customer’s experience.
Here is the thing about a churn rate: it is a number that describes the past. You calculate it, you watch it move, and by the time it moves, the customers are already gone. Customer experience measurement works the other way around. A subscriber’s satisfaction starts slipping long before they cancel, and if you are listening, that slip is visible.
So this guide covers the basics that every subscription operator should know, then spends most of its time on the half that almost nobody measures: the experience signals that predict churn instead of just recording it.
Voluntary vs Involuntary Churn, and Why They Need Different Measurement
Not all churn is the same, and the distinction decides how you measure it.
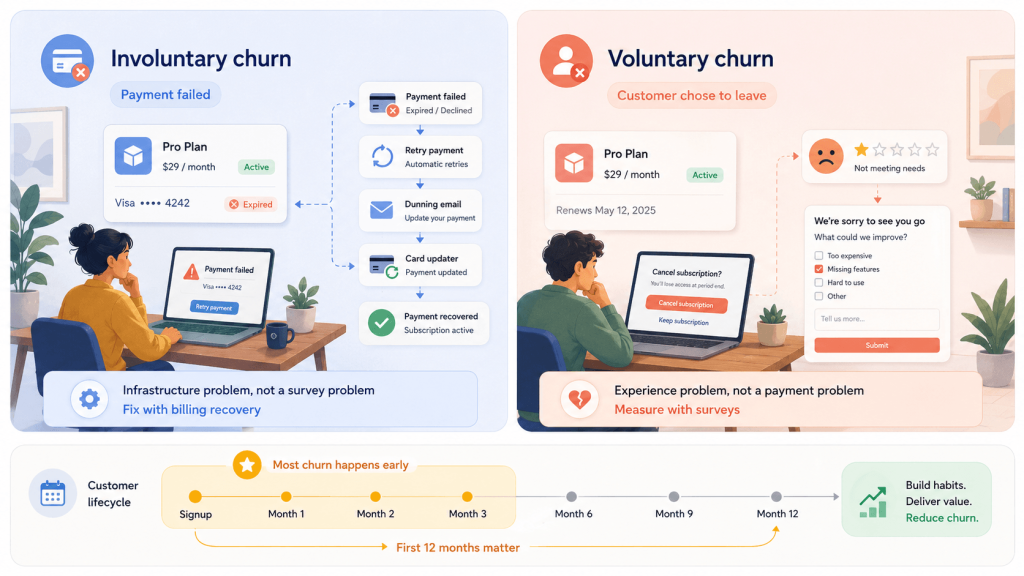
Involuntary churn happens when a payment fails: an expired card, an insufficient balance, or a hard decline. The customer did not choose to leave. They just stopped paying without meaning to. This is a billing and recovery problem, solved with dunning, smart retries, card updaters and pre-dunning emails. It is worth taking seriously because it is a bigger slice than most brands assume. Recurly reports that involuntary churn makes up 53% of total churn, though that figure runs high compared with other sources. Churnkey, drawing on Stripe data, puts it lower, in the range of 9% to 29% of churn depending on category. The honest read is that involuntary churn sits somewhere in that wide band; it varies a lot by vertical, and it is almost always under-addressed. Fix it with payment infrastructure, not surveys.
Voluntary churn is the one this guide is really about. The subscriber made a decision to cancel. Something in the experience stopped being worth the recurring charge. No retry logic recovers that customer, because nothing technical broke. What broke was the experience, and the only way to measure it is to ask.
This is where timing gets urgent. Recurly’s benchmark data puts overall subscription churn at 3.27%, and notes that 66% of all cancellations happen within the first 12 months. Loop’s 2026 Shopify churn guide cites 5% to 7% monthly churn as typical for DTC subscriptions. Whatever your exact number, the pattern holds: most of the bleeding happens early, in the window where a subscriber is still deciding whether the habit is worth keeping. That is exactly the window where experience measurement earns its keep.
The Metrics That Measure Experience, Not Just Count Churn
Churn rate, retention rate and customer lifetime value are essential business metrics, and you should track all of them (our guide to increasing customer lifetime value goes deep on the economics). But they are outcomes. They tell you what happened, not how your subscribers feel about what is happening. For that, you need experience metrics. Three do most of the work.
Net Promoter Score (NPS): the relationship health check
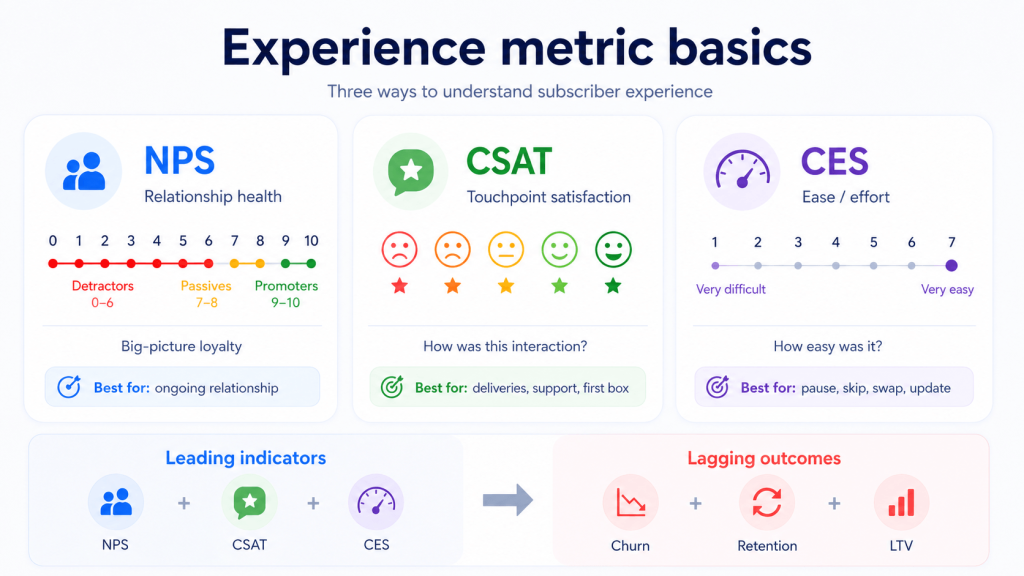
NPS asks one question: how likely are you to recommend us, on a scale of 0 to 10. It is a relationship metric, best run on a steady cadence rather than tied to a single event, which makes it a natural fit for the recurring nature of a subscription.
Across 50+ ecommerce brands in Retently’s data, the overall NPS landed at 55.3, with about 70% Promoters and 15% Detractors. That benchmark is useful, but the trend line for your own subscribers matters more than the absolute number. A subscriber base whose NPS drifts down quarter over quarter is a subscriber base about to churn, even if today’s revenue looks fine. For more on reading the trend rather than the snapshot, see our piece on cumulative vs monthly NPS. If you are new to running NPS in a retail context, start with our NPS for ecommerce guide.
Customer Satisfaction (CSAT): the touchpoint pulse
CSAT measures satisfaction with a specific interaction: the first box, a delivery, or a support conversation. It is granular where NPS is broad. For a subscription brand, CSAT is how you catch a single touchpoint going wrong before it poisons the whole relationship.
The practical advantage is response rate. In Retently’s ecommerce data, CSAT surveys pulled a 9.76% response rate, roughly double NPS at 4.45%. People are more willing to rate a thing that just happened than to evaluate an entire relationship.
Customer Effort Score (CES): the quiet churn predictor
CES asks how easy it was to get something done. For subscriptions, “something” is usually managing the plan: pausing, skipping a shipment, swapping a product, or updating an address. And here is the part most brands miss. Effort, not delight, is the strongest predictor of whether a customer stays.
In a landmark study of more than 75,000 customers, Harvard Business Review found that reducing effort beats exceeding expectations for building loyalty. The numbers are stark: 94% of customers who had a low-effort experience intended to repurchase, and 88% said they would spend more. Among high-effort customers, 81% said they would spread negative word of mouth. The same research found that satisfaction and loyalty are not the same thing at all. 20% of “satisfied” customers said they intended to leave, while 28% of “dissatisfied” customers intended to stay.
The study is from 2010 and focused on service interactions, so treat it as a foundational principle rather than a fresh benchmark. But the principle is exactly right for subscriptions: a subscriber who finds it hard to skip a box is a subscriber learning that the easiest way to control their subscription is to cancel it. Recurly notes that pause usage jumped 337% in its 2026 subscription data, which tells you subscribers want flexibility, not exit. If pausing is high-effort, you convert that flexibility-seeker into a churned customer.
CES also happens to be the easiest signal to collect. In Retently’s data it pulled a 22.54% response rate, about five times NPS. People who just struggled with something are very willing to tell you about it. Our Customer Effort Score guide covers how to deploy it.
The shift in mindset is this: NPS, CSAT and CES are leading indicators. Churn rate is a lagging one. The whole point of measuring experience is to act on the leading signal, while the lagging one can still be changed.
The Survey Moments That Map to the Subscriber Lifecycle
Knowing the metrics is half of it. The other half is knowing when to deploy them, because a subscription is not a single moment. It is a series of them, and each one is a chance to measure.
Post-fulfillment surveys: catch the experience while it is fresh
A subscription is delivered, over and over. Each delivery is a measurable event. Send an NPS or CSAT survey after the box lands, not after the charge clears, because the box is what the customer actually experiences.
Timing matters. Retently’s data shows post-fulfillment NPS works best 7 to 14 days after delivery, with 7 days the single most common send delay. Early enough that the experience is fresh, late enough that the product has been used. (Our post-purchase and post-fulfillment survey guide breaks down the timing question in detail.)
What you learn shifts across the lifecycle, and the shift is revealing. In Retently’s segmentation, repeat buyers were noticeably more critical of shipping than first-timers (46.2% negative sentiment vs 37.3%). The same delivery experience that a new customer forgives, a long-time subscriber resents, because they have been let down before. Measuring at each shipment is how you catch that erosion.
Cancellation-reason surveys: research, not a coupon trigger
Most subscription tools bolt an exit survey onto the cancel flow for one reason: to fire a discount and save the sale. That is fine as a tactic. It is a waste as a measurement system.
Every cancellation reason is a piece of structured voice-of-customer data. Aggregate them, trend them over time, and route them to the teams who can fix the underlying cause, and your cancel survey stops being a coupon dispenser and becomes a product and operations roadmap. “Too expensive” trending up means a value-perception problem. “Got too much product” means your default cadence is wrong. “Couldn’t pause easily” means a CES problem you can fix this sprint.
The payoff is real. Livingood Daily, a DTC brand, cut its churn from roughly 10% to 2.26% by building a real cancellation flow on top of exit surveys and analyzing the reasons, then acting on them (a personalized founder video for one at-risk segment alone drove a 13% reduction in churn over the following 30 days). That is one brand’s self-reported result, not an industry guarantee, but the mechanism is sound: they measured why people left, and they fixed it.
Relationship NPS on a renewal cadence
Layered over the event-based surveys, run a relationship NPS survey on a regular cadence, timed to the rhythm of your renewals. This is your steady pulse on whether the overall value still feels worth it, independent of any single delivery. A Detractor here, weeks before their renewal date, is the clearest at-risk signal you will get.
One channel note worth acting on: where you ask changes how many answer. In Retently’s data, in-app surveys pulled a 32.34% response rate against 3.24% for email, roughly ten times higher. If you have an app or an account portal where subscribers manage their plan, that is the highest-yield place to ask.
A Lifecycle Signal Map You Can Steal
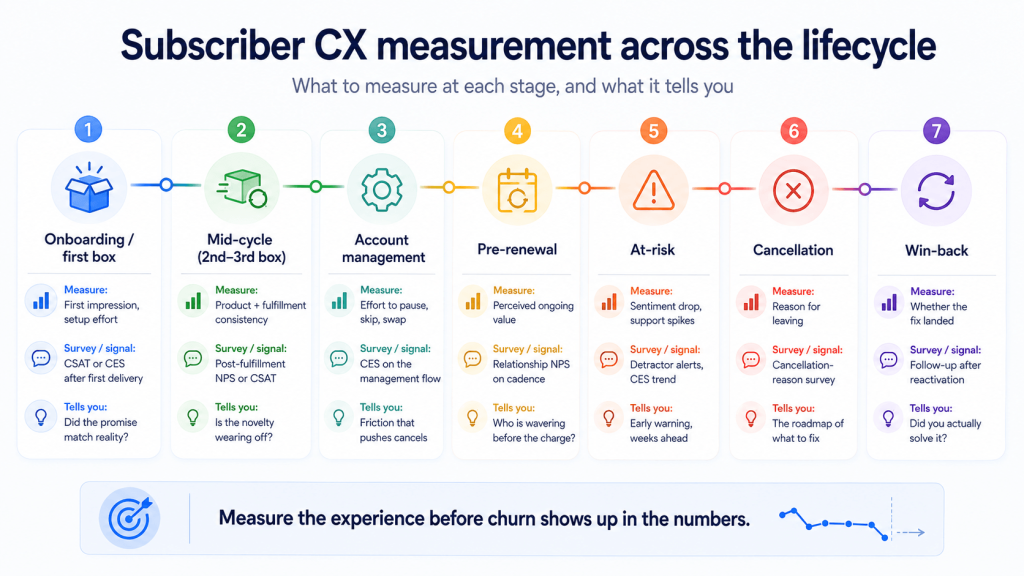
Put it together and you get a measurement plan that follows the subscriber instead of waiting at the exit. Here is the map.
| Lifecycle stage | What to measure | Survey or signal | What it tells you |
|---|---|---|---|
| Onboarding / first box | First impression, setup effort | CSAT or CES after first delivery | Did the promise match reality |
| Mid-cycle (2nd to 3rd box) | Product and fulfillment consistency | Post-fulfillment NPS or CSAT | Is the novelty wearing off |
| Account management | Effort to pause, skip, swap | CES on the management flow | Friction that pushes cancels |
| Pre-renewal | Perceived ongoing value | Relationship NPS on cadence | Who is wavering before the charge |
| At-risk | Sentiment drop, support spikes | Detractor alerts, CES trend | Early warning, weeks ahead |
| Cancellation | Reason for leaving | Cancellation-reason survey | The roadmap of what to fix |
| Win-back | Whether the fix landed | Follow-up after reactivation | Did you actually solve it |
The reason this map matters is that some problems are invisible without it. Here is the finding that makes the case better than any framework diagram.
In Retently’s ecommerce dataset, we tagged friction by theme and split it by customer type. Subscription friction (skip, pause, cancel problems, the “unwanted automatic order”) was a top complaint among repeat buyers, showing up with 42.6% negative sentiment. Among first-time buyers, it did not crack the top concerns at all. It was effectively absent.
Sit with that for a second. The single biggest experience problem in a subscription business is one that your first-purchase metrics, your checkout surveys and your billing reports cannot see, because it only exists inside the recurring relationship. If you measure only the acquisition experience, you are blind to the thing most likely to churn your best customers. The only way to see it is to measure the subscriber, specifically, on an ongoing basis.
Turning Feedback Into a Churn Prediction
Once the signals are flowing, the goal is to combine them into an at-risk flag that fires early. No single metric is a perfect predictor, but together they form a pattern.
A subscriber who scores as a Detractor on relationship NPS, whose CES on the management flow is climbing, and whose last post-fulfillment CSAT dropped, is telling you something a churn report will not for another month or two. That combination is your intervention trigger. The point of measuring is not to admire the dashboard. It is to generate a list of named accounts that a human can reach before the cancel button does.
One caution for subscription-box and replenishment brands in particular: do not assume the problem is the product. In Retently’s data, the dominant friction class for subscription-box customers was not product quality, it was platform and technical reliability. Technical bugs and errors ran 100% negative. Missing-order complaints ran 98.8% negative. Website and account UX ran 82.6% negative.
For a recurring model, the machinery of the subscription (the portal, the billing, the order accuracy) is where trust is won or lost. Measure it directly, because intuition will point you at the product instead. For the broader pattern of what pushes customers out, our breakdown of the three leading causes of customer churn is a useful companion.
Closing the Loop: Measure, Then Act
Here is the half of the job that every competing guide skips. Collecting the signal is worthless if nothing happens next.
A closed loop has three moves. First, the inner loop: when a Detractor or a high-effort response comes in, route it to a person who reaches out to that specific subscriber, fast, to recover the relationship. Silence after a complaint is its own message, and it is the wrong one. (Even a non-response carries information, which we cover in interpreting survey silence.)
Second, the outer loop: aggregate the feedback, find the systemic issue (the cadence that is too aggressive, the pause flow that is too hard, the carrier that is too slow), and fix it at the root so the next cohort never hits it.
Third, the follow-up: after you ship the fix or run the win-back, survey again to confirm it landed. A retention tactic you never measure is a guess. This is the difference between a feedback program and a feedback theater, and it is also where survey data stops being a vanity metric and starts protecting revenue. If you want the metric definitions behind all of this in one place, our guide to NPS, CSAT and CES covers the fundamentals.
The Bottom Line
Subscription churn is not really a billing problem or a cancellation-flow problem, even though those are the two lenses most of the industry uses. It is an experience problem wearing a financial disguise. The cancellation is the last event in a story that started cycles earlier, and that story is written in feedback you can collect if you choose to.
The brands that keep their subscribers are not the ones with the slickest discount-at-cancel offer. They are the ones who measure the experience continuously, catch the slipping subscriber while there is still time, and close the loop by actually fixing what the data points to. Churn becomes something you see coming instead of something you report after the fact.
That measurement layer is exactly what Retently is built for. If you run a subscription brand and want to put NPS, CSAT, CES and post-fulfillment surveys to work across your subscriber lifecycle, start a free trial or book a demo and see how early you can spot churn before it happens.
Frequently Asked Questions
How do I reduce churn in my subscription service? Start by separating the two kinds of churn. Fix involuntary churn (failed payments) with dunning and smart retries. Reduce voluntary churn by measuring the experience: run NPS, CSAT and CES across the subscriber lifecycle, treat cancellation reasons as research, and intervene with at-risk subscribers before they cancel rather than after. Most retention tactics work better when they fire on an early signal, and experience metrics are that signal.
What is a good churn rate for a subscription business? It depends on category and price point. Recurly’s benchmark data puts overall subscription churn around 3.27%, while DTC ecommerce subscriptions often run higher, in the mid-single-digit percent range per month. The more useful number is your own trend over time and your first-year churn, since roughly two thirds of cancellations happen in the first 12 months.
What is the difference between voluntary and involuntary churn? Involuntary churn is when a payment fails and the subscriber lapses without intending to. You fix it with billing tools. Voluntary churn is when a subscriber actively decides to cancel because the experience stopped being worth it. You can only understand voluntary churn by collecting feedback, because nothing technical broke.
How often should I survey subscribers? Match the survey to the moment. Send post-fulfillment surveys after deliveries (7 to 14 days works well), run relationship NPS on a steady cadence tied to renewals, trigger CES after any plan-management action, and always survey at cancellation. Avoid surveying the same subscriber so often that you create fatigue.
Which survey is best for predicting subscription churn? No single one. Customer Effort Score is the strongest individual predictor of disloyalty, especially around managing the subscription, but the reliable signal comes from combining a falling NPS, a rising CES and recent negative CSAT into a single at-risk view.

 Christina Sol