



You add a comment box to the last screen of your survey, label it “Anything else you’d like us to know?”, and wait for the insight to roll in. Most people skip it. The ones who answer write “great product” or “no, all good.” Weeks later, you have a column of blanks and platitudes, and no read on why last month’s satisfaction dipped.
Qualitative survey questions are how you get the why behind the number, but only if you design them to give it back. This isn’t a flat dump of open-ended examples, and it isn’t a catalog of every question format. It’s the narrower, harder part: when a qualitative question earns its slot, how to write one whose answers cluster into something you can act on, and how to run it alongside your metrics rather than in place of them.
Key Takeaways
- A question is qualitative because of its output, the language and themes you read, not because it’s open-ended. The format is a consequence, not the definition.
- Reach for qualitative when you need the why or the unknown, quantitative when you need a number to trend or benchmark. A scale can’t explain a churn spike; a comment box can’t be charted.
- What kills qualitative data usually isn’t wording, it’s scope. “Any feedback?” scatters answers so nothing clusters. Design each question around the theme you’ll code later.
- A written answer costs the respondent far more than a tap, so spend it deliberately: one open question per survey, placed last, after the number.
- Pair the two. A closed metric tells you something moved; one open “why” tells you what to do about it.
What makes a survey question qualitative?
The defining trait isn’t the blank box. It’s the output. A qualitative question returns language you have to read and interpret (reasons, stories, descriptions) rather than a value you can average. Most qualitative questions are open-ended, because a free-text field is the easiest way to collect language. But the two ideas come apart at the edges. A “select all that apply” list is closed in format, yet you often read it as categories rather than a score.
So sort by what you’ll do with the answer, not how the field looks: read and theme it, it’s qualitative; count or chart it, it’s quantitative. The full open-versus-closed and qualitative-versus-quantitative grid lives in our guide to survey question types, and this piece picks up where that hands off.
Qualitative vs quantitative: when each one wins
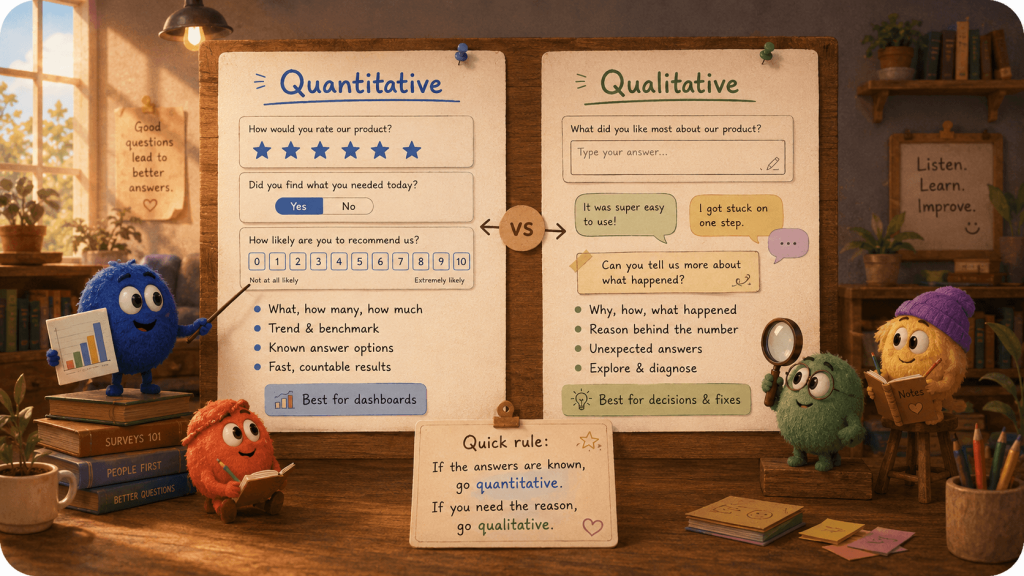
Quantitative questions answer what, how many, and how much. They give you a number you can trend, benchmark against a peer set, and drop into a chart untouched. Quantitative, closed questions are the workhorses for exactly that: a rating, a yes/no, an NPS score.
Qualitative questions answer why, how, and what happened. They’re how you diagnose a problem you can already see in the numbers, and how you find the ones you didn’t know to look for. When a satisfaction score slides four points and nobody on the team can say why, more rating scales won’t tell you. A single well-aimed open question will.
The decision rule is short: if you already know the possible answers, go quantitative for a fast, countable result; if you can’t predict what people will say, or you need the reason behind a number you already have, that’s qualitative’s job. The quick version to keep at your desk:
| Reach for quantitative when… | Reach for qualitative when… |
|---|---|
| You need a number to trend or benchmark | You need the reason behind the number |
| The answer options are known and finite | You can’t predict what people will say |
| You’re measuring at scale, fast | You’re diagnosing or exploring |
| The result feeds a dashboard | The result feeds a decision or a fix |
The false economy runs both ways. Trend a comment box and you’ll spend a week hand-summarizing what a scale would have counted instantly. Explain a cancellation spike with a 1-to-5 rating and you’ll get a tidy average that says nothing about the cause. Match the format to the decision.
How to design qualitative questions you can actually analyze
Here’s the part most guides skip. They say “be specific” and “avoid bias,” which is true of any question. The failure specific to qualitative questions isn’t wording. It’s scope. Ask “Any feedback for us?” and you get answers about pricing, a bug, the delivery driver, and the logo color, one of each, clustering into nothing.
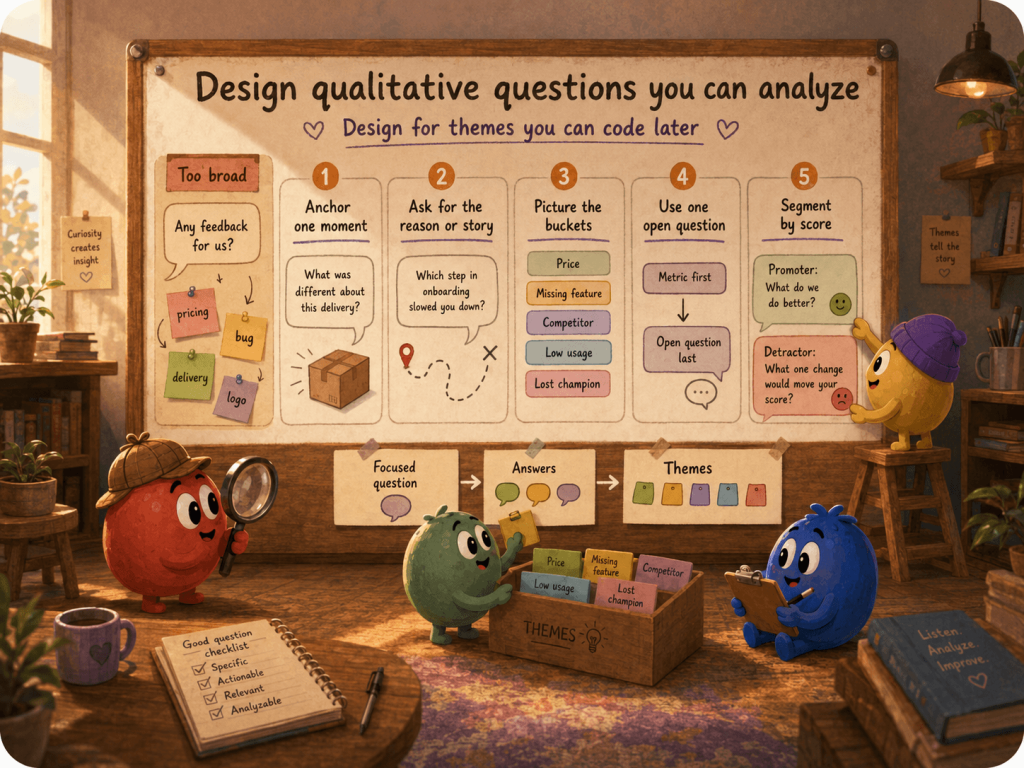
The fix is to design every open question around the theme you’ll code later. Five principles get you there.
1. Anchor to one concrete moment or object. “How do you feel about us?” can’t be answered usefully. “What was different about this delivery compared to your last one?” points every respondent at the same thing, so their answers land in the same pile.
2. Ask for the reason or the story, not a disguised yes/no. “Was onboarding clear?” invites “yes.” “Which step in onboarding slowed you down?” invites the detail you can act on. Open the door to a narrative, not a nod.
3. Design for the buckets you expect. Before you ship the question, picture the five to eight themes the answers will sort into. For a churn question that might be price, a missing feature, a lost champion, a competitor switch, or low usage. If you can’t picture the buckets, the question is too broad. This one habit separates a qualitative question you can analyze from one you can only read and sigh at.
4. Spend your one open question deliberately. A written answer costs the respondent far more than a tap, and the budget is thin to start with: across our own sends, the typical account gets roughly 5% of its survey emails answered, with about half never opened (Retently, trailing 12 months). So keep it to one open question, placed last, after the closed metric. The craft and order rules for writing good questions apply here, too.
5. Segment the prompt by the score before it. A Promoter and a Detractor should not get the same “why.” Ask a happy customer what you do better than the alternative; ask an unhappy one what single change would move their score. Same slot, two prompts, twice the signal.
Design the question for themes and the analysis stops being a slog. Once answers cluster, coding them by hand or with software is a reading job, not an excavation. For big volumes, hand it to a tool built to analyze open-text at scale; we won’t rebuild that here.
Qualitative survey questions by moment: weak vs analyzable
Most example banks sort qualitative questions by abstract type: exploratory, descriptive, emotional. That’s not how you deploy them. You fire a question at a moment, and the moment decides what’s worth asking. Below is one weak, generic version and one redesigned, analyzable version for each moment a CX program actually surveys. If you want a big flat list to browse, our open-ended examples bank has it; this section is about the redesign.
Post-purchase and delivery (ecommerce). Weak: “Any feedback on your order?” Analyzable: “When your order arrived, what was the first thing you noticed?” Pinned to the unboxing moment, answers cluster into condition, packaging, and timing instead of scattering across your store.
Onboarding and first run. Weak: “How was getting set up?” Analyzable: “Which step in setup took longer than you expected?” Answers are sorted by step (import, integration, first configuration), showing exactly where new users stall.
After a support interaction. Weak: “How did we do?” Analyzable: “What would have gotten your issue resolved faster?” Responses cluster around effort drivers (wait time, repeated explanations, handoffs) and the signal you want once a ticket closes.
Cancellation and churn. Weak: “Why are you canceling?” Analyzable: “What changed for your team that made now the right time to cancel?” The reframe surfaces the trigger (a budget cut, a champion leaving, a competitor switching, an adoption that never took hold) instead of a defensive one-liner. Most guides skip this moment; it’s often the most useful one you’ll run.
Renewal and expansion (B2B). Weak: “Any thoughts before your renewal?” Analyzable: “What would you need to see from us next quarter to expand how your team uses this?” Answers cluster into expansion blockers (a missing capability, unproven ROI, low adoption), which the account team can work directly on. For accounts showing risk rather than health, swap the prompt: “What would make renewing an easy call this year?” surfaces the objection before it becomes a cancellation.
Product and feature feedback. Weak: “What features do you want?” Analyzable: “What did you try to do this week that the product wouldn’t let you finish?” A feature wish list is noise; a list of jobs people couldn’t finish clusters into real gaps, ranked by frequency.
NPS follow-up. Weak: “Why did you give that score?” Analyzable, split by score: ask Promoters “What’s the one thing you’d tell a colleague we do better than their current tool?” and Detractors “What single change would move your score up?”. Promoter answers cluster into strengths to lean on, Detractor answers into a ranked fix list. For more on getting text back on NPS, see our guide to qualitative NPS feedback.
How to combine qualitative and quantitative in one survey
The strongest surveys aren’t all one or the other. They pair a closed metric for the number with a single open question for the reason, in that order. Rendered:
How likely are you to recommend us to a friend or colleague? 0 1 2 3 4 5 6 7 8 9 10
What’s the main reason for your score? [ your answer ]
The number comes first because the order changes the answers. Run warm-up questions before the metric and you risk nudging a lukewarm customer into a friendlier score before you’ve measured it. Ask it cold, then ask why.
Keep the discipline to one open question. Adding “what could we improve?” right after the main-reason box feels harmless, but every extra open field competes for the same scarce attention and lowers your odds of a thoughtful answer to either. One number, one why.
The two data types answer each other. The score tells you something moved: satisfaction dropped, effort spiked, loyalty climbed. The text tells you what to do about it. A number without a reason is an alarm with no address; a reason without a number is an anecdote you can’t size.
Spend the open question where it counts
Qualitative questions buy you the why, and at a price: the answers are harder to analyze, and they cost the respondent real effort. That trade is worth making, as long as you make it on purpose. Design each open question around the theme you’ll code, anchor it to one moment, spend just one per survey, and place it after the number that tells you something moved. Do that and the pile of comments becomes a short list of fixes.
Retently renders NPS, CSAT, and CES as neutral, single-tap metrics with a follow-up open question built in, scored the standard way, so the number stays comparable and the “why” arrives right beside it. Start a free trial to send one to your own customers, or browse the ready-made survey templates to see the pattern in place.
Frequently Asked Questions
What are qualitative survey questions? Qualitative survey questions collect language instead of numbers. They ask for reasons, stories, and descriptions, an open “Why did you cancel?” rather than a 1-to-5 rating, so the output is text you read and group into themes. Usually open-ended, they’re what you use to understand the why behind a metric rather than to measure it.
Are open-ended survey questions qualitative or quantitative? Almost always qualitative. An open-ended question returns free text, which is qualitative data by definition. The exception is when you convert that text into a count, tagging each answer positive or negative and analyzing the tallies. The format is open; the data stays qualitative until you deliberately quantify it.
What’s the difference between qualitative and quantitative survey questions? Quantitative questions produce numbers you can average, trend, and benchmark: ratings, yes/no, NPS. Qualitative questions produce language you interpret for themes and reasons. Quantitative tells you what and how many; qualitative tells you why and how. Most good surveys use a closed metric for the number and one open question for the reason.
How many qualitative questions should a survey have? Usually one. A written answer costs far more effort than tapping a scale, and attention is scarce, so a second open field mostly buys you a second blank. Ask your closed metric, then a single open “why” last. A periodic relationship survey can carry two, if each maps to a different decision.
How do you analyze qualitative survey data? You code it: read a sample, define the recurring themes, then tag every answer to a theme so you can count and track them. Questions built around a small set of expected buckets make this fast. For large volumes, text-analytics and AI tools tag sentiment and themes automatically, so teams can read thousands of comments without reading each one by hand.

 Christina Sol