



The renewal looked like a formality. A mid-market software vendor had a two-year contract in place and quarterly numbers that pointed straight up. Then the renewal wobbled, and the one person the account manager kept checking in with, was the last to know. Someone inside that account had seen it coming for months, yet, nobody was asking them.
That account didn’t have one customer. It had five, each on a different path through the relationship, and the vendor measured none of them except the buyer. That’s the trap of treating a B2B customer as a single person. The customer is an account: a group of people who arrive at different moments, judge you on different outcomes, and send different signals. Draw the journey as one line, and you miss most of it.
What Makes the B2B Customer Journey Different (It’s an Account, Not a Person)
Start with the number that reframes everything. Dreamdata’s 2026 LinkedIn Ads Benchmarks Report puts the average B2B purchase at around ten stakeholders, up from 6.8 a year earlier, spread across 88 touchpoints and roughly 281 days (close to nine months) from first touch to revenue. Gartner has long put the buying group for a complex purchase at six to ten decision-makers, each with their own agenda and research. The buying group is not an edge case. It is the shape of the deal.
Those people don’t want to be sold to the same way, either. In Gartner’s 2026 sales survey, 67% of B2B buyers said they’d prefer a rep-free buying experience, and McKinsey’s B2B Pulse research keeps finding the same split: at any point in the journey, buyers divide roughly evenly across in-person, remote, and self-service channels, regardless of country, industry, or deal size. So the journey isn’t just longer than a consumer one, but wider and quieter, split across more people and channels.
That width separates B2B from B2C. Here’s the contrast:
| B2B customer journey | B2C customer journey | |
|---|---|---|
| Who the “customer” is | A buying group of roughly ten roles | Usually one person |
| Cycle length | Months to over a year | Minutes to weeks |
| Decision style | Committee, consensus, documented ROI | Individual, often emotional |
| Defining moments | Contract, kickoff, QBR, renewal | Purchase, delivery, repurchase |
| Where value compounds | Post-sale: onboarding, expansion, renewal | Repeat purchase and loyalty |
In ecommerce, the journey collapses back to a single shopper and a handful of touchpoints, which is why mapping the buyer’s journey with surveys in retail looks nothing like it does in B2B.
One distinction trips up many teams. The lifecycle and the journey aren’t the same thing: the lifecycle is the macro arc of the relationship, its customer lifecycle stages over months and years, while a journey map zooms into the touchpoints inside one experience. In B2B, that zoom-in matters more, since a single stage can pull five roles in different directions, and the whole thing sits inside your broader customer experience management program. For the general single-persona method this builds on, see our customer journey map guide.
The Stakeholders in a B2B Account (and Why Each Has Its Own Journey)
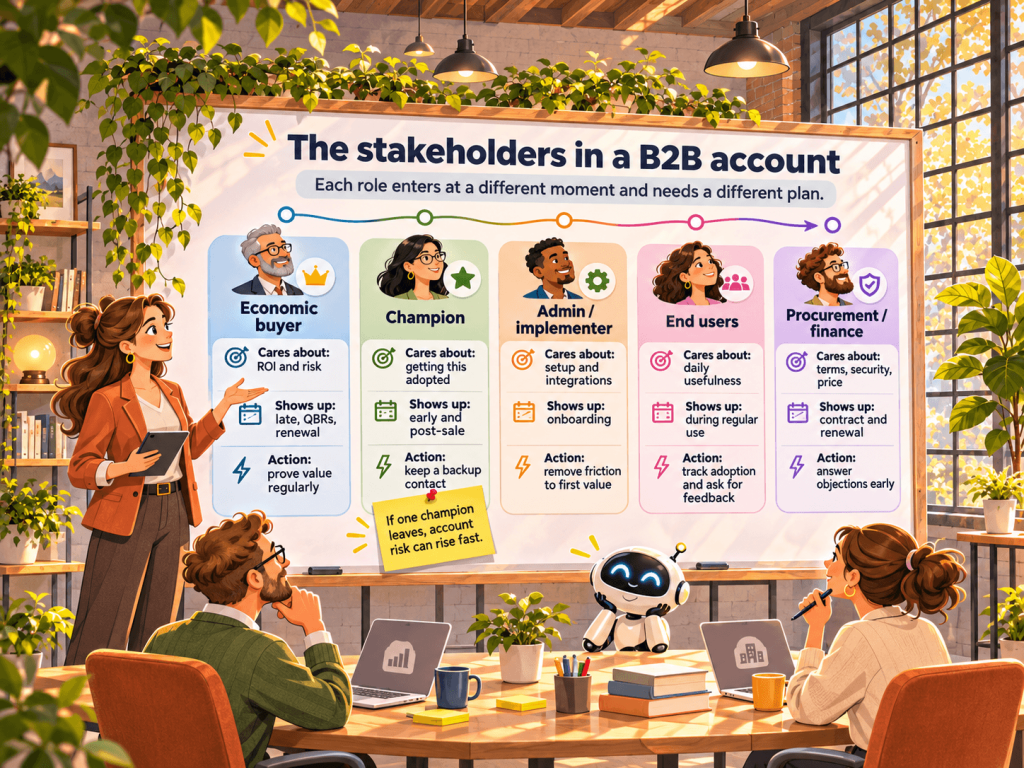
Before you can map an account, you have to name the people in it. Most B2B deals feature some version of these five roles, and each enters at a different point with a different definition of success.
The economic buyer (or decision-maker) owns the budget and signs the contract. They enter late, care about ROI and risk, and mostly resurface at the quarterly review and the renewal. Their signal is worth the most for retention and the least for product fixes.
The champion is the internal advocate who wanted this in the first place. They build the case, wrangle the other stakeholders, and own the rollout after purchase. When a champion leaves, a healthy account can tip into risk overnight. Because that can happen to any account, keep a second contact in each critical role, so the relationship never depends on one person.
The admin or implementer does the technical work: setup, configuration, integrations, user provisioning. They feel every rough edge during onboarding, and their experience decides how fast the account reaches first value.
End users are the largest group and the quietest. They log in (or don’t), form the real opinion of whether the product works, and make exactly zero renewal decisions. Their feedback is the most honest and detailed, and usually the last thing anyone collects.
Procurement and finance show up at contract time and again at renewal, focused on terms, security, and price. Not experience stakeholders in the day-to-day sense, but they can stall or unstick a deal, so they belong on the map.
The split matters for measurement, not org charts. Buyers and users routinely disagree about the same product: Gainsight’s Customer Success Index found decision-makers rated products higher (an average NPS around 46) than the people using them daily (a median closer to 36). Survey only the buyer and you get a flattering read that misses the frustration building underneath. That gap is the whole argument for deciding who to survey in B2B on purpose, and for surveying more than one role.
The B2B Customer Journey Stages, End to End
Laid out flat, a B2B account moves through seven stages: awareness, evaluation, purchase and contract, onboarding and implementation, adoption and expansion, renewal, and advocacy. If you use the five-stage lifecycle model, awareness through purchase fold into acquisition and renewal sits within retention; the B2B map splits them out because different roles act in each. Most guides lavish attention on the pre-sale stages. They deserve the least of yours here, since that ground is well covered and a survey can’t fire before there’s a customer to survey.
So keep the front end tight. In awareness and evaluation, the buying group self-educates, compares options, and builds consensus, largely without talking to you (Gartner and McKinsey, linked above, own that pre-sale depth). Purchase and contract is where procurement and finance enter, terms get negotiated, and the deal closes.
Everything interesting for experience measurement happens after the signature. Onboarding and implementation is the highest-stakes stage in the arc: the admin configures the product and the account either reaches first value or stalls. Adoption and expansion is the long middle where usage becomes habit, end users form their verdict, and seats or modules grow. B2B adds rituals here that consumer journeys never see: the kickoff call, the quarterly business review (QBR), the mid-term check-in. Renewal holds or quietly ends the relationship, often decided by whether anyone caught a problem in the two stages before it. Advocacy is the payoff, when a happy champion becomes a reference or a case study.
The post-sale weighting is deliberate. In SaaS, the survey sequence across trial, onboarding, ongoing use, and renewal is worth studying on its own, which we cover in SaaS customer journey surveys. And if you doubt the metric fits business buyers, the case for NPS for B2B is stronger than most teams assume.
The Account-Level Map: Stages x Stakeholders
Here’s the move very few make. Most guides tell you a B2B purchase involves six to ten people, then draw a single line for one generic persona anyway. The stakeholders get named in a paragraph and vanish from the map.
A B2B customer journey map should be a grid, not a line. Stages run across the top, stakeholders down the side, and each cell holds what that role is doing at that stage: touchpoints, goal, friction. Read a column, and you see one stage across everyone in the account; read a row, and you follow one stakeholder’s whole sub-journey. The champion’s row and the end user’s row are different journeys through the same deal, and the grid makes both visible at once.
| Stakeholder | Evaluation | Purchase & Contract | Onboarding | Adoption & Expansion | Renewal | Advocacy |
|---|---|---|---|---|---|---|
| Economic buyer | Sets criteria, owns budget | Signs the deal | Sees the kickoff | Reviews ROI at QBR | Relationship NPS | NPS to case study |
| Champion | Builds the internal case | Aligns stakeholders | Owns the rollout | Drives expansion | Relationship NPS | NPS to referral / review |
| Admin / implementer | Scopes technical fit | Plans setup | CES on setup effort | Configures new use cases | Confirms it still works | – |
| End users | Rarely involved | – | First login | CSAT after key interactions; product feedback | – | – |
| Procurement / finance | Vets vendor, security | Negotiates terms | – | – | Reworks paperwork, pricing | – |
The empty cells are as informative as the full ones. Procurement goes silent through the middle of the account and loud at the edges. End users don’t exist to you before onboarding and become the center of gravity during adoption. Those per-cell touchpoints are the B2B customer journey touchpoints that a one-line map flattens into a single averaged path.
Where Feedback Fires: The Right Survey per Stage and per Stakeholder
The grid has cells often never filled: the feedback ones. Naming the stakeholders is half the work; the other half is deciding which survey fires in which cell. A metric aimed at the wrong moment or the wrong person returns noise you’ll mistake for signal.
Three metrics do most of the job, and each reads a different thing. CES (Customer Effort Score) measures how hard a task was. CSAT (Customer Satisfaction Score) measures satisfaction with a specific interaction. NPS (Net Promoter Score) reads the overall relationship and, at the top end, surfaces the people willing to recommend you. Match each to the cell it was built for:
- Onboarding, to the admin: fire a CES survey right after the first key setup task. Setup effort is exactly what a satisfaction score misses, and the admin is the only one who feels it.
- Adoption, to end users: send CSAT after a meaningful interaction, plus a product-feedback survey to learn what to build next. This is the honest read the buyer can’t give you.
- Retention, to the buyer and champion: run relationship NPS starting 7 to 30 days after they convert, then every 60 to 90 days. This is your renewal early-warning system, aimed at the people who actually decide it.
- Advocacy, to the champion: NPS does double duty here. A 9 or 10 from a champion is a Promoter you can route straight to a referral, a review, or a reference call.
That mapping stays consistent with how we sequence metrics across the customer lifecycle stages. The two axes make “survey the account” specific: ask the admin about effort, users about satisfaction, the buyer about loyalty. Those are the questions each can actually answer.
How to Build Your B2B Customer Journey Map
You don’t need a week of sticky notes. You need the grid filled in with what you already know, then kept current. Five steps.
1. Define the account and its roles, not one persona. List the stakeholder types in your deals: buyer, champion, admin, end users, procurement. That’s the side axis, and the step every single-line map skips.
2. Lay out the stages end to end. Put the full arc across the top, then weight your detail toward onboarding through renewal, where you have the most influence and the most to lose.
3. Fill each cell. For every stakeholder at every stage, note the touchpoint, the goal, and the friction. Empty cells tell you when a role is dormant, which is useful on its own.
4. Place a survey in the cells that matter. Drop CES into onboarding for the admin, CSAT into adoption for users, relationship NPS into retention for the buyer and champion. Wire each to fire on the event, not a calendar. Tag each response with the account and the respondent’s role, so you can compare roles inside one account, as we do in how Retently uses Retently.
5. Keep it live. A journey map is not a poster. Close the loop when a score comes back low, and refresh the map at each QBR and ahead of every renewal.
On templates, since “b2b customer journey map template” is a common search, the grid above is the template. Stages across the top, roles down the side, survey cells marked. You can rebuild it in a spreadsheet in ten minutes.
A B2B Customer Journey Map Example
Walk one account through the grid. A mid-market SaaS company buys a workflow tool. During evaluation, a VP of operations (the champion) builds the case and loops in an IT lead to scope integrations, and the CFO signs off on budget. No survey fires yet, and that’s correct.
At onboarding, the IT lead configures the integration and provisions two teams. A CES survey lands right after setup and comes back middling, flagging a clunky permissions step, and support smooths it in week one before it sours the rollout. Through adoption, CSAT surveys go to both user teams after their first month. One team is happy; the other keeps rating a specific report as painful, which becomes a product-feedback thread.
Two months before renewal, a relationship NPS survey goes to the champion and the VP. The champion’s score has slipped, tied to that same report the users flagged. Now the account team has a specific, named problem and a runway to fix it, not a surprise at renewal. That’s the difference the grid makes: five separate reads, each from the person best placed to give it, early enough to act.
Turning the Map Into a Managed Account
A single-line journey map is a comforting fiction. It tells a story about “the customer” that no real B2B account matches, because a real account is five people going five directions, and the one you forget to measure is usually the one who decides your renewal. Drawing the map as a grid is what keeps that from being a surprise.
That’s the layer Retently is built for: the measurement and closed-loop piece across the account journey. The surveys that fire at the right stage for the right stakeholder: CES for the admin, CSAT for the users, relationship NPS for the buyer and champion, with Promoters routed to referrals and low scores to a follow-up, all wired into the CRM you already run. Start a free trial to see where each role in your accounts actually stands, or book a demo to map it with us.
Frequently Asked Questions
How is the B2B customer journey different from B2C? The B2B customer is an account, not a person. A single purchase involves a buying group of roughly ten people, the cycle runs months rather than minutes, and decisions are made by committee against documented ROI. B2B also has kickoff, QBR, and renewal moments that consumer journeys never see.
Who should you survey in a B2B account? More than one role. Survey the admin about setup effort, end users about day-to-day satisfaction, and the buyer or champion about the overall relationship. Buyers and users often score the same product differently, so surveying only your main contact gives a partial, flattering picture.
How do you create a B2B customer journey map, and is there a template? List your stakeholder roles down the side, the stages across the top, and fill each cell with that role’s touchpoints, goals, and friction. Then place a survey in the cells that matter. The stages-by-stakeholders grid above is the template.
What’s the difference between the customer journey and the buyer journey? The buyer journey is the pre-sale path to a purchase decision, the sales-funnel view. The customer journey includes everything after the signature too: onboarding, adoption, renewal, and advocacy. In B2B, where value compounds post-sale, mapping only the buyer journey leaves the more important half of the account unmeasured.

 Christina Sol




 Greg Raileanu