



A customer wrote to us with a simple question. Their dashboard said October’s NPS was 67. The monthly report, for the same October and the same responses, said 66. Which one was right?
Both were. The two screens used the same responses and the same subtraction, but they rounded at different moments, and a point fell out in between.
This post covers what we found when we went looking, the two fixes we argued over, and the one rule every score in Retently has followed since November 2026.
Key Takeaways
- Round a score once, at the very end, from exact response counts. Rounding the percentages first and then subtracting can move NPS by a point.
- The two methods disagree for roughly one in four possible response mixes, and never by more than one point.
- Each customer counts once, by their latest response in the period. XSAT is the exception: it counts every response.
- When you combine days, campaigns or segments, add up the counts first. Don’t average scores that are already rounded.
- Most Retently scores that moved did so by one point. No customer’s responses changed.
Two right answers to the same question
Here’s that October, with the customer’s name left out. In that month, 2,210 customers responded: 1,742 Promoters, 194 Passives and 274 Detractors.
NPS is the percentage of Promoters minus the percentage of Detractors. That sounds like one formula. In practice there are two ways to run it.
Round at the end. Take (1,742 − 274) ÷ 2,210 × 100. That’s 66.43, which rounds to 66.
Round the parts first. Promoters are 78.82% of the total, so call it 79%. Detractors are 12.40%, so 12%. Then 79 − 12 = 67.
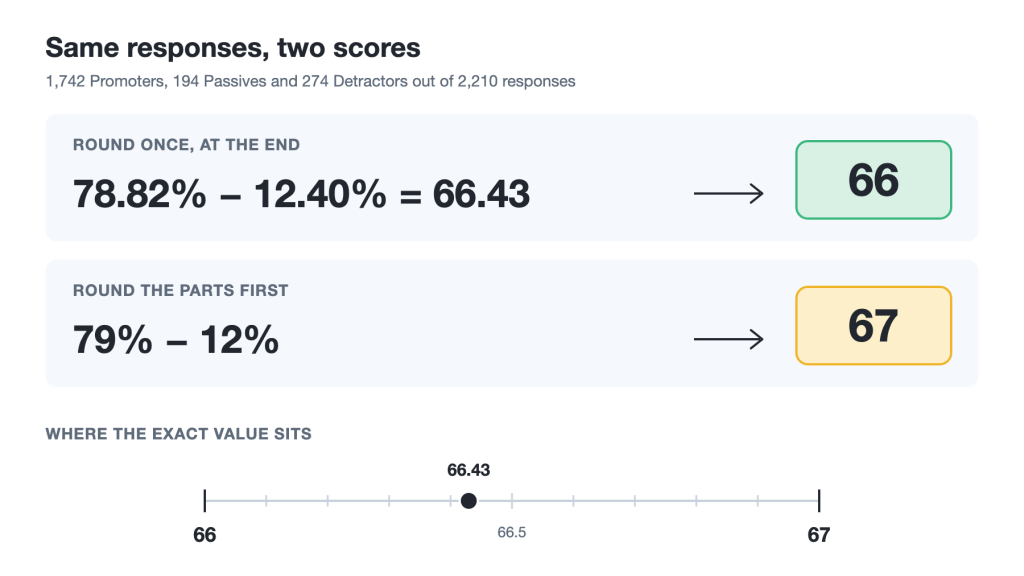
Neither is a bug in the usual sense, and the second method even has a real advantage, which is that it matches what people do in their heads. If a dashboard shows 79% Promoters and 12% Detractors, anyone can subtract and get 67.
But it’s less accurate. Each rounding step can be off by up to half a point, and when you round twice and then subtract, those errors can stack. The true value here was 66.43. Calling it 67 is a stretch.
How often does this happen?
More often than we expected. We checked every possible mix of Promoters, Passives and Detractors for surveys of up to 400 responses, about 10.8 million combinations. The two methods disagree in 24.9% of them, and the gap is never more than one point.
That’s a count of possibilities, not of real accounts, but it told us this wasn’t a rare edge case.
One point is small, and nobody should change strategy over 66 versus 67. (If you’re wondering whether either number is good, our NPS benchmarks cover that.) The damage is of a different kind. A team that catches its numbers disagreeing once starts double-checking all of them, and that costs more than the point ever did.
What we found when we looked wider
If two screens disagree, how many other places calculate a score? We ran two independent reviews of the whole product: the web app, reports, email digests, the API and integrations.
They came back with about 29 places where a score is calculated or displayed. Most agreed with each other, and four kinds of disagreement turned up.
- Two NPS formulas. Most of the product rounded the parts first. The monthly report, the geographic report and our benchmarks rounded at the end.
- 5-Star ratings one-tenth apart. Twenty ratings that add up to 43 average 2.15. One part of the product showed 2.2, another showed 2.1. The cause is an old one: 2.15 can’t be stored exactly in binary, so a common formatting function sees 2.1499 and rounds down.
- Averages of averages. Say Monday brings 3 CSAT responses with 2 satisfied (67%), and Tuesday brings 7 with 1 satisfied (14%). Average the two daily scores, (67 + 14) ÷ 2, and you get 40.5, shown as 41%. But 3 satisfied customers out of 10 is 30%. Some grouped views, including the headline number in email digests, averaged.
- One metric with two populations. XSAT counted every response on the dashboard and only the latest one per customer in two reports.
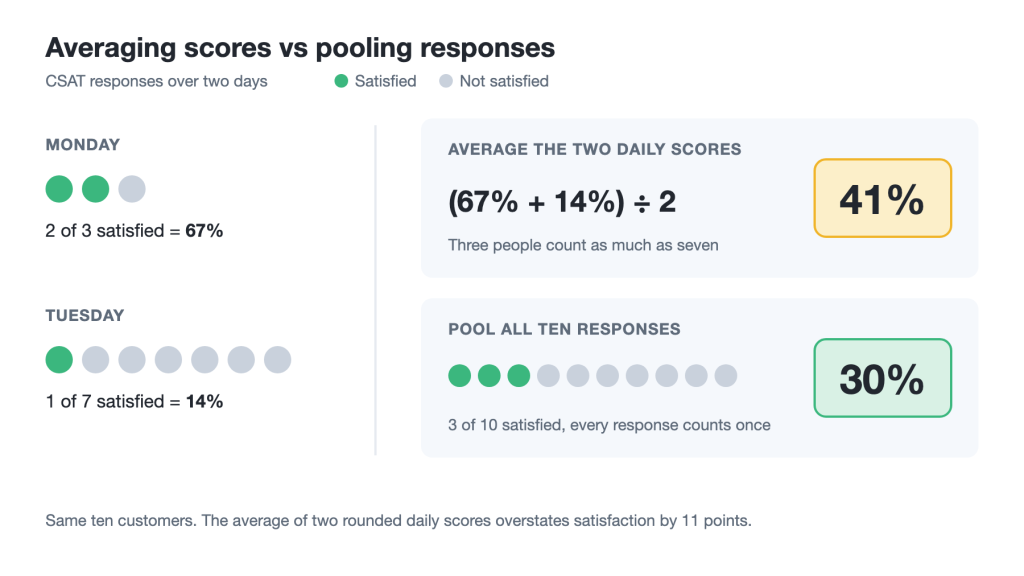
None of these was dramatic on its own. Together they meant “what’s our score?” had a slightly different answer depending on where you asked.
The debate: easy to check, or exact?
Both reviews agreed on the diagnosis. They recommended opposite fixes.
Option one: round the parts first, everywhere. Only the two reports would change. Nothing would move on the dashboard, in the API or in anyone’s automations. Customers could keep verifying a score by hand from the percentages on screen. It was also about a third of the work.
Option two: round once at the end, everywhere. This is the more precise method, but it touches the dashboard, campaigns, trends, digests and the API. In our count, about a quarter of possible NPS results would land a point away, for customers who had done nothing.
We went with option two.
Accuracy compounds. Scores feed other numbers: changes over time, trends, grouped totals, benchmarks. A half-point error at the bottom turns into a full point somewhere above it.
The “check it by hand” advantage turned out to be something we could keep, by changing what the score calculator shows.
And we’d rather make one announced change than carry a small permanent inaccuracy. We can stand behind a score that moves a point with an explanation; a quiet one-point error would need explaining every time someone noticed it.
The standard
Every score in Retently now follows five rules.
1. Calculate from exact counts, round once
| Metric | Calculation | Shown as |
| NPS | 100 × (Promoters − Detractors) ÷ total | Whole number, −100 to 100 |
| CSAT, CES, XSAT, Emoji, Thumbs, PMF | 100 × positive responses ÷ total | Whole percentage |
| 5-Star | Sum of ratings ÷ total | One decimal |
The score is never calculated from percentages that have already been rounded for display.
2. Exact halves round away from zero
So 12.5 becomes 13, and −12.5 becomes −13. This only matters for NPS, the one metric that can go negative, and it’s less obvious than it looks: the default rounding in JavaScript turns −12.5 into −12. We wanted the rule to be symmetric, so a score sitting exactly on the half moves away from zero whichever side it’s on.
3. Multiply before you divide
This one sounds pedantic. Take 23 satisfied customers out of 40: that’s 57.5%, which should show as 58.
Ask a computer for 23 ÷ 40 × 100 and you get 57.49999999999999, which rounds to 57. Ask for 100 × 23 ÷ 40 and you get 57.5 exactly. The only difference is the order of operations.
4. Pool counts, don’t average scores
Whenever we combine days, campaigns or segments, we add up the response counts and calculate one score from the total. There’s one deliberate exception: a digest that mixes different metrics (NPS and CSAT campaigns, for example) still shows an average, because Promoters and satisfied customers can’t be pooled into one count.
One side effect is worth knowing about. On screens that show a change between two periods, such as Products and Topics, the change is calculated from the exact scores and rounded once, so it can differ by a point from subtracting the two scores you see. And the three category percentages are each rounded separately, so they can add up to 99% or 101%.
5. Each customer counts once, except in XSAT
For NPS, CSAT, CES, 5-Star, Emoji, Thumbs and PMF, each customer contributes their latest response in the period you’re looking at. If someone answered 6 in the first week and 10 in the last, the score uses the 10. That holds whether you look at a single month or a cumulative view.
XSAT is the exception. It’s designed to cover every interaction, so every response counts.
Before this release, two of our reports applied the “latest only” rule to XSAT as well. A customer who answered 1 and later 5 showed as 50% satisfied on the dashboard and 100% in the monthly report. Both now say 50%.
Response volume is a separate number. Volume charts and topic mentions still include every response; the count shown beside a score is the one-per-customer population that score was calculated from.
Making the math checkable again
If a dashboard shows 79% and 12% next to a score of 66, people will reasonably conclude we can’t subtract.
So the score calculator on the dashboard now shows percentages to one decimal:
78.8% − 12.4% ≈ 66
We spent longer on that ≈ than you’d guess. With one decimal the parts nearly always subtract to the score, but not always.
Five Promoters and one Detractor out of nine responses display as 55.6% − 11.1%, which is 44.5, next to a score of 44 (the exact value is 44.44). An equals sign would sometimes be wrong. The ≈ is always true.
We also considered showing the raw counts, (1,742 − 274) ÷ 2,210 × 100 = 66, which is exact every time. It was harder to read at a glance, so the simpler version won.
What changed for Retently customers
- Some scores moved by one point. Current and past values on the dashboard, campaigns, trends, digests and the API now use the round-once method. The responses themselves are untouched.
- Grouped numbers can move by more. Where we used to average scores (the headline number in a single-metric digest, for example), the pooled score can differ by several points.
- A few screens can move by more, too. Products, Topics and the feedback audit now count each customer’s latest response, like the rest of Retently. In accounts where people often respond more than once, scores there can shift by more than a point, and the response counts beside them can be lower.
- XSAT in the monthly and geographic reports now counts every response, and XSAT campaign cards show a score where they showed none before.
- Anything already exported or sent keeps its numbers. PDFs, CSVs and past digests are historical records.
- The API keeps its shape.
scoreis still a whole number (one decimal for 5-Star), with no new fields.
If you calculate NPS yourself
Plenty of teams keep a spreadsheet alongside their survey tool, and the same traps apply there. Three habits keep the numbers consistent:
- Keep the raw counts and calculate the score from them every time. Don’t store percentages and subtract them later.
- When you combine months or regions, add the counts. Don’t average the scores.
- Decide once whose response counts when a customer answers twice, and write it down.
If your spreadsheet and your survey tool disagree by a point, check the rounding order before anything else. And if you’d rather skip the spreadsheet, our NPS calculator works from the raw counts.
FAQ
Why does my NPS differ by one point between two reports or tools?
Almost always because of rounding order. One calculation rounds the Promoter and Detractor percentages before subtracting; the other subtracts exact values and rounds once. The two approaches disagree for about one in four response mixes, by a single point. Larger gaps usually come from different date ranges, time zones or rules for customers who responded more than once.
Should NPS be rounded to a whole number?
Yes. NPS is reported as a whole number between −100 and 100. Calculate it from exact response counts and round only the final result. Showing decimals suggests more precision than a survey sample can support, and rounding earlier in the calculation can shift the result by a point.
How do you round NPS when it lands exactly on .5?
Round exact halves away from zero: 12.5 becomes 13 and −12.5 becomes −13. Many tools round −12.5 to −12 instead, because that’s what their default rounding function does. Either rule is defensible, but it has to be the same one everywhere a score appears, or two reports will disagree in the rare month a score lands exactly on the half.
Did this change alter any survey responses?
No. Every response is stored exactly as the respondent gave it. Only the calculation on top changed. On most screens the Promoter, Passive and Detractor counts are the same as before and only the final rounding differs. A few screens now count each customer’s latest response, so their counts can be lower.
One rule, written down once
Most of this work wasn’t the formula. It was making sure there is one rule: every screen, export, digest and API response is held to the same set of test cases, and an automated check rejects the old round-the-parts formula if it reappears.
The next time a customer asks which number is right, we can answer without opening two screens.
See how your own scores add up. Start a free trial or book a demo.

 Christina Sol


 Greg Raileanu