



When reviewing customer experience data, two terms appear constantly: “rating” and “score.” Many professionals use them interchangeably, but they represent fundamentally different concepts. Mixing them up can lead to misread data and muddled reporting. This guide clarifies the distinction and explains how each metric type handles these concepts differently.
Rating: The Raw Customer Input
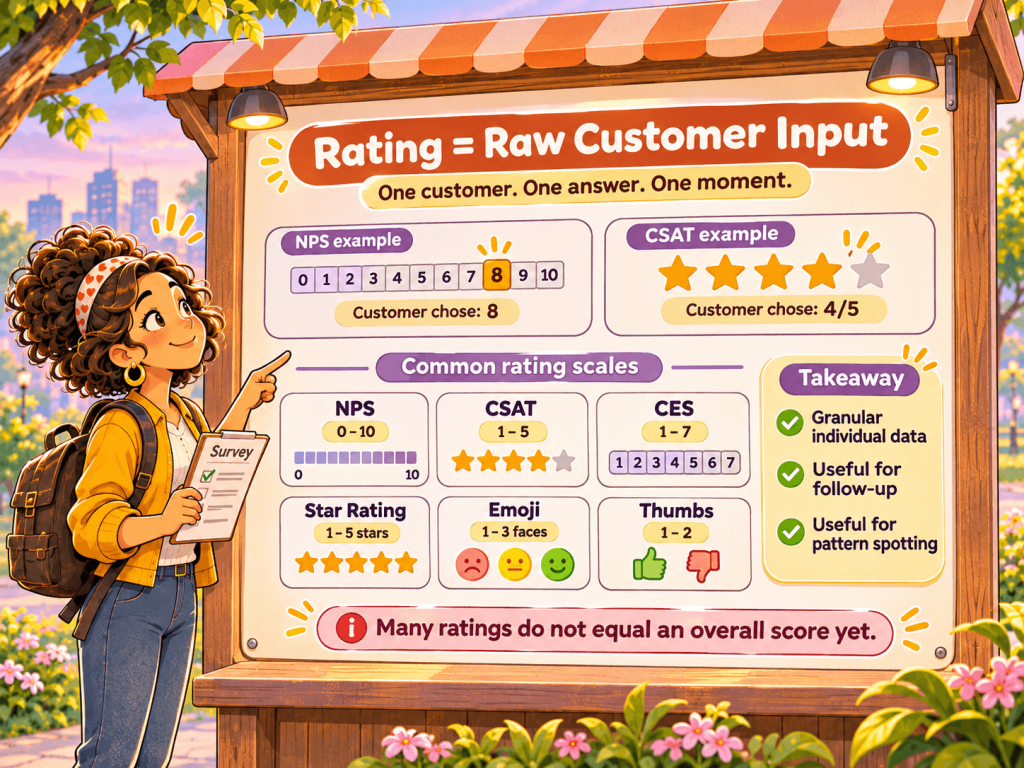
A rating is the individual response value a customer provides when completing a survey. It’s the raw, unprocessed input – a single data point representing one customer’s opinion at one moment in time.
When a customer sees an NPS survey asking “How likely are you to recommend us to a friend?” and selects 8, that 8 is their rating. When another customer completes a CSAT survey and chooses 4 out of 5 stars, that 4 is their rating.
Each survey metric type uses a different rating scale:
| Metric | Rating Range | What the Customer Sees |
|---|---|---|
| NPS | 0-10 | Scale from 0 to 10 |
| CSAT | 1-5 | 5-point satisfaction scale |
| CES | 1-7 | 7-point effort scale |
| Star Rating | 1-5 | 5 stars |
| Emoji | 1-3 | Sad, Neutral, Happy faces |
| Thumbs | 1-2 | Thumbs Down, Thumbs Up |
Ratings are granular. They tell you exactly what each customer selected. This granularity is valuable for individual follow-ups, identifying specific unhappy customers, or analyzing response patterns over time. But a collection of individual ratings doesn’t provide a quick answer to “How are we doing overall?”
That’s where scores come in.
Score: The Calculated Business Metric
A score is a calculated, aggregated metric derived from multiple ratings. It transforms raw customer inputs into a single number that represents overall performance.
The critical insight: different metrics calculate their scores differently.
NPS Score Calculation
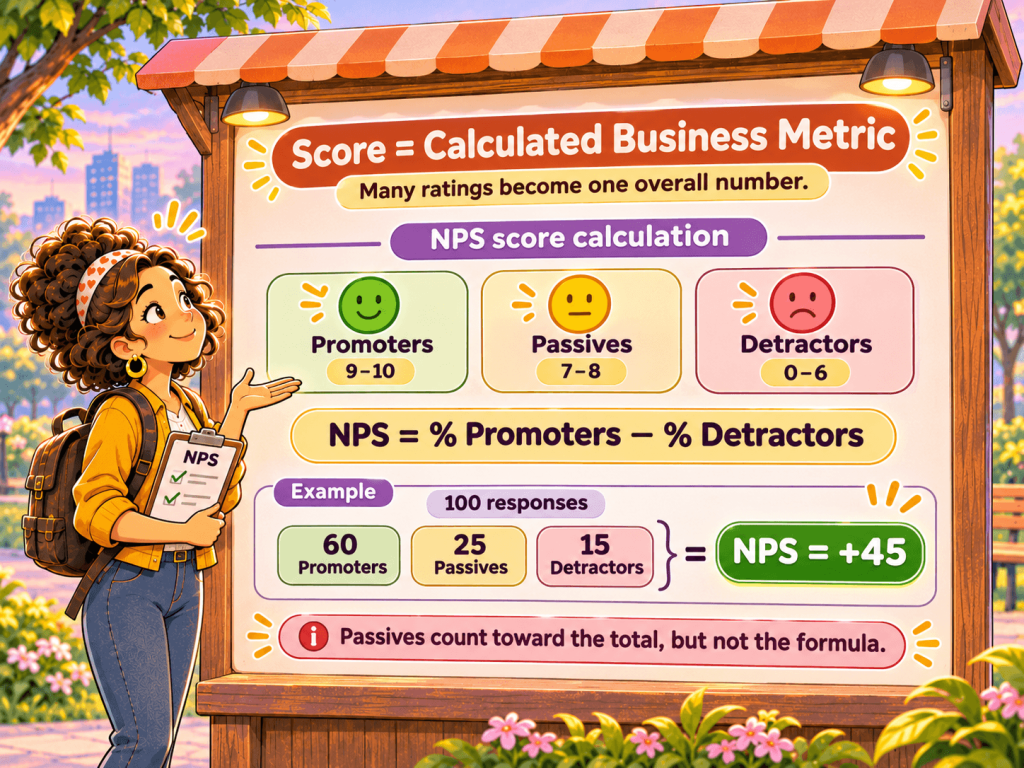
Net Promoter Score uses the most distinctive calculation. Ratings are first classified into three categories (more in What is NPS?):
- Promoters (9-10): Loyal enthusiasts who will keep buying and refer others.
- Passives (7-8): Satisfied but unenthusiastic customers vulnerable to competition.
- Detractors (0-6): Unhappy customers who can damage your brand through negative word-of-mouth.
The NPS score formula: NPS = % Promoters − % Detractors
This produces a score ranging from −100 (everyone is a Detractor) to +100 (everyone is a Promoter). Passives count toward the total but don’t directly affect the calculation.
Example: You collect 100 responses. 60 customers gave 9 or 10 (Promoters), 25 gave 7 or 8 (Passives), and 15 gave 0-6 (Detractors). Your NPS = 60% − 15% = 45.
Notice how a rating of 8 and a rating of 7 produce the same effect on the score (both are Passives), even though customers may perceive those as different satisfaction levels.
CSAT, CES, and Other Percentage-Based Scores
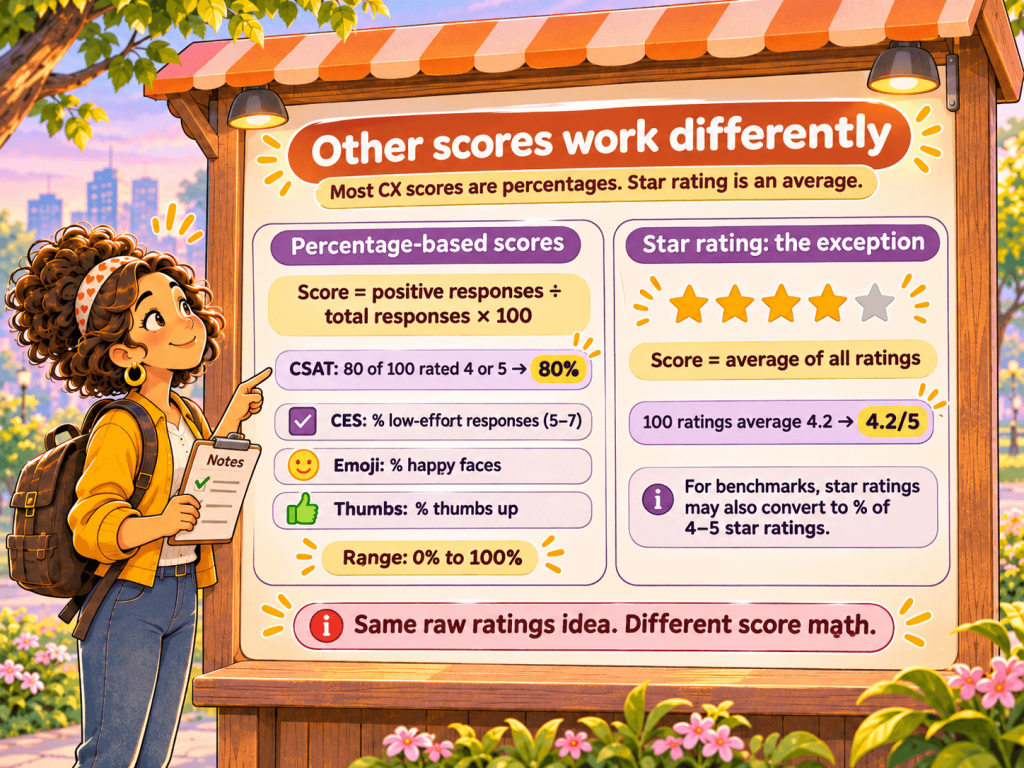
Most other CX metrics use a simpler calculation: the percentage of positive responses, though some tools report CSAT and CES as averages instead. For the full calculations and benchmarks, see our guides to CSAT and CES.
CSAT Score = (Number of satisfied responses ÷ Total responses) × 100
For CSAT with a 1-5 scale, “satisfied” typically means ratings of 4 or 5. If 80 out of 100 customers gave a 4 or 5, your CSAT score is 80%.
The same logic applies to:
- CES (Customer Effort Score): Percentage of low-effort responses (5-7 on a 1-7 scale)
- Emoji surveys: Percentage of happy faces
- Thumbs surveys: Percentage of thumbs up
All these produce scores from 0% to 100%.
Star Rating: The Exception
Star ratings work differently. Instead of calculating a percentage, the score is the average of all ratings.
If 100 customers give ratings averaging 4.2, your star rating score is 4.2 out of 5. This matches user expectations – when people see star ratings on Amazon or Google, they expect an average, not a percentage.
However, for benchmark comparisons, even star ratings often convert to a percentage (the percentage of 4-5 star ratings) to enable apples-to-apples comparison with industry data.
Category Classifications: How Ratings Become Segments
Before calculating a score, ratings must be classified into categories. Each metric type defines its own thresholds:
NPS (0-10 scale)
| Category | Rating Range | Meaning |
|---|---|---|
| Detractors | 0-6 | Unhappy, risk of churn |
| Passives | 7-8 | Satisfied but not loyal |
| Promoters | 9-10 | Loyal advocates |
CSAT (1-5 scale)
| Category | Rating Range | Meaning |
|---|---|---|
| Unsatisfied | 1-2 | Negative experience |
| Neutral | 3 | Neither satisfied nor dissatisfied |
| Satisfied | 4-5 | Positive experience |
CES (1-7 scale)
| Category | Rating Range | Meaning |
|---|---|---|
| High Effort (Negative) | 1-3 | Difficult experience |
| Neutral | 4 | Moderate effort |
| Low Effort (Positive) | 5-7 | Easy experience |
Star Rating (1-5 scale)
| Category | Rating Range | Meaning |
|---|---|---|
| Negative | 1-2 | Poor experience |
| Neutral | 3 | Average experience |
| Positive | 4-5 | Good experience |
Emoji (1-3 scale)
| Category | Rating | Meaning |
|---|---|---|
| Negative | 1 (Sad) | Unhappy |
| Neutral | 2 (Neutral) | Indifferent |
| Positive | 3 (Happy) | Happy |
Thumbs (1-2 scale)
| Category | Rating | Meaning |
|---|---|---|
| Negative | 1 (Down) | Disapproval |
| Positive | 2 (Up) | Approval |
Note that Thumbs surveys have no neutral category – customers must choose positive or negative.
Why the STAR Metric Handles Benchmarks Differently
Star ratings present a unique challenge for benchmarking. Users intuitively understand averages (4.2 stars), but industry benchmarks typically report satisfaction as percentages (“78% satisfaction rate”).
To solve this, CX platforms often display star ratings as averages in dashboards while using the percentage of positive ratings (4-5 stars) for benchmark comparisons.
Example:
- Dashboard displays: 4.2 stars (the average)
- Benchmark comparison uses: 72% (the percentage of 4-5 star ratings)
- Industry benchmark: 68% satisfaction
- Result: You’re performing +4 points above industry average
This dual approach gives users the familiar average rating while enabling meaningful comparison against industry standards.
Practical Implications: When to Use Rating vs Score
Understanding the difference helps you use the right data for the right purpose.
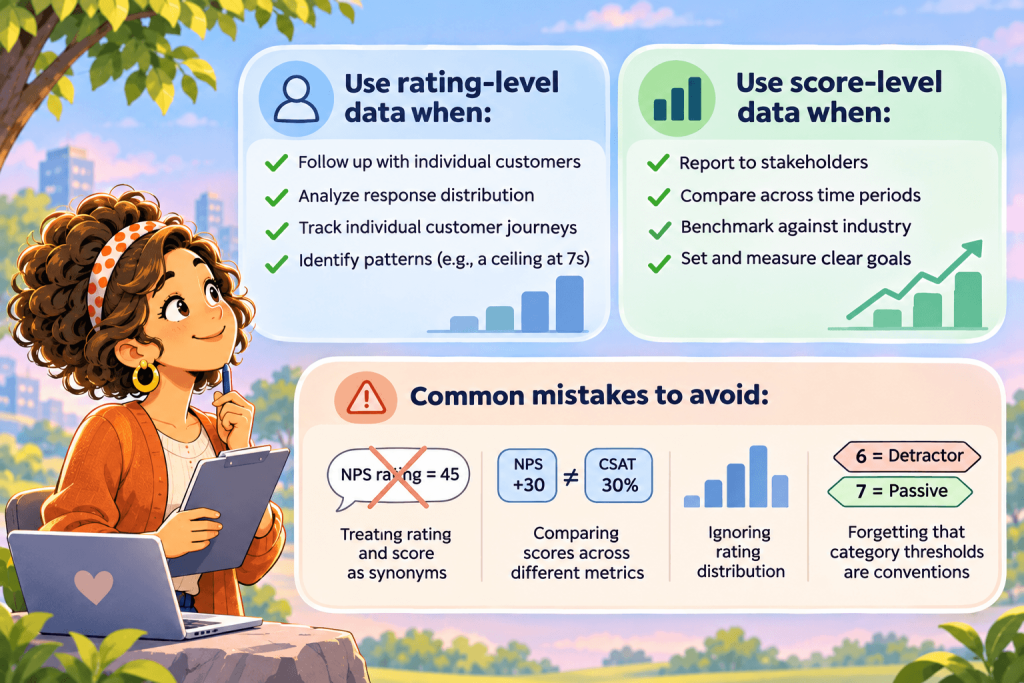
Use Rating-Level Data When:
Following up with individual customers. If a customer gave an NPS rating of 3, you want to know that specific number to gauge the severity and personalize your outreach.
Analyzing response distribution. A score of +40 could come from 50% Promoters and 10% Detractors, or from 70% Promoters and 30% Detractors. The rating distribution reveals the underlying reality.
Tracking individual customer journeys. Seeing that a customer’s rating improved from 7 to 8 over three surveys shows progress, even though both might classify as the same category in some metrics.
Identifying patterns. Rating-level analysis might reveal that customers consistently give 7s rather than 8s, suggesting a ceiling on satisfaction that aggregate scores would hide.
Use Score-Level Data When:
Reporting to stakeholders. Executives and board members need a single number that answers “How are we doing?” The score provides that clarity.
Comparing across time periods. Tracking your NPS score month-over-month shows trends without drowning in individual data points.
Benchmarking against competitors or industry. Industry benchmarks report scores, not rating distributions. To compare, you need your score.
Setting and measuring goals. “Improve NPS from +35 to +50” is a clear, measurable objective. “Get more 9s and 10s” is vague.
Common Mistakes to Avoid
Treating rating and score as synonyms. Saying “Our NPS rating is 45” is technically incorrect – 45 is the score. The ratings are the individual 0-10 values that customers provided.
Comparing scores across different metrics. An NPS of +30 is not comparable to a CSAT of 30%. They use different scales and calculations.
Ignoring rating distribution. Two teams with identical scores might have very different rating distributions. One might have engaged customers (strong opinions both ways), while another has apathetic customers (mostly Passives).
Forgetting that category thresholds are somewhat arbitrary. Why is a 6 a Detractor but a 7 a Passive? These boundaries are conventions, not laws of nature. They’re useful for standardization but shouldn’t be treated as absolute truth.
Quick Reference Summary
| Term | Definition | Example (NPS) |
|---|---|---|
| Rating | Individual customer response | Customer selected 9 |
| Score | Aggregated business metric | NPS is +45 |
| Category | Classification of a rating | 9 = Promoter |
| Promoters % | Percentage of positive ratings | 60% are Promoters |
| Metric | Rating Range | Score Calculation | Score Range |
|---|---|---|---|
| NPS | 0-10 | Promoters% − Detractors% | −100 to +100 |
| CSAT | 1-5 | % of 4-5 ratings | 0-100% |
| CES | 1-7 | % of 5-7 ratings | 0-100% |
| Star | 1-5 | Average rating | 1-5 |
| Emoji | 1-3 | % of happy responses | 0-100% |
| Thumbs | 1-2 | % of thumbs up | 0-100% |
Conclusion
Ratings and scores serve different purposes in customer experience measurement. Ratings capture the voice of individual customers – granular, specific, and essential for personalized action. Scores aggregate those voices into a single metric – comparable, trackable, and essential for strategic decisions.
Conflating the two leads to confusion in reporting and analysis. By understanding that a rating is what customers give you and a score is what you calculate from those ratings, you’ll communicate more precisely, analyze more accurately, and make better decisions based on your CX data.
The next time someone asks about your “NPS rating,” you’ll know to clarify: do they want the score (+45) or are they asking about individual customer ratings? That clarity makes all the difference.
Frequently Asked Questions
1. Is NPS a rating or a score?
NPS is a score. The 0-10 answers customers give are ratings, and the score is calculated from them: the percentage of Promoters minus the percentage of Detractors.
2. Can I compare scores from different metrics?
No. NPS runs from −100 to +100, CSAT and CES are usually percentages, and star ratings are averages on a 1-5 scale. An NPS of +30 and a CSAT of 30% measure different things, so compare each score only with its own benchmark.
3. Why do star ratings use an average when other metrics use a percentage?
People expect an average from stars, as they see on Amazon or Google, so dashboards show the average. For benchmarks, Retently normalizes star ratings into a CSAT-equivalent score so they can be compared with industry data.
4. Can two companies have the same score and very different customer sentiment?
Yes. An NPS of +40 could come from 50% Promoters and 10% Detractors, or from 70% Promoters and 30% Detractors. The distribution of ratings shows which situation you’re in, so look at it alongside the score.
5. Should I report ratings or scores?
Both, for different audiences. Use the score for executives, trends and benchmarks, and use individual ratings to follow up with customers and spot patterns the score hides.

 Christina Sol




 Greg Raileanu