


Your checkout analytics tell you exactly where shoppers leave, maybe 68% at the shipping step. What they can’t tell you is why. Sticker shock at the total? A flicker of doubt when the card form loaded? Or someone who was only browsing and never meant to buy today?
Those three shoppers look identical in a funnel report, and each needs a different fix. A cart abandonment survey is the cheapest way to tell them apart. This guide covers how to run one people actually answer: one question, at the right moment, every answer routed to a fix.
Key Takeaways
- A cart abandonment survey diagnoses why shoppers leave; analytics only show where. Run it alongside your recovery email, not instead of it.
- Keep it to one question. Abandoners have already declined to buy, so every extra field costs responses.
- Trigger it right: on-site exit intent on the checkout page, or inside the abandoned-cart email your store already sends within a day.
- Make the answer options double as a routing map, each reason pointing to a specific fix.
- Around 42% of abandoners are just browsing, so the survey’s job is to distinguish between never-buyers and shoppers who hit a wall.
What a cart abandonment survey is
A cart abandonment survey is a short survey shown to shoppers who add items to their cart and then leave without buying. Its one job is diagnosis: to capture, in a single tap or a line of text, why they didn’t finish.
It’s a different tool from the abandoned-cart recovery email. The recovery email persuades, nudging one shopper back with a reminder or discount. The survey diagnoses, so you can stop the next hundred from leaving for the same reason. Run both: the survey feeds the fix, the email works the individual cart.
The Baymard Institute reports an average documented cart abandonment rate of 70.22% across 50 studies. Treat that as a starting line, not a benchmark. Rates swing hard by category, with Beauty and Personal care in the low 80s or Home & Furniture in the high 70s on Dynamic Yield’s rolling benchmark, so your own baseline is the only figure worth comparing against.
Why survey abandoners when you already have analytics
Heatmaps, funnel reports, and session recordings show where shoppers drop off: which step, which field, which page. What they can’t explain is intent. A funnel shows people leaving on the shipping page; it can’t say whether the cost was a shock, the date was too far out, or the shopper never meant to buy. It’s the question operators keep asking each other: Do you actually know why customers abandon, or are you guessing?
In Baymard’s study, the top reason for abandoning wasn’t price or friction. It was just browsing and not ready to buy, at 42%. Among those who hit a real obstacle, 40% pointed to extra costs like shipping and taxes, 19% didn’t trust the site with their card details, and 18% balked at forced account creation.
So nearly half of abandonment isn’t a checkout bug; it’s ordinary browsing. The survey’s real job is to separate shoppers who were never going to buy from those who wanted to and hit a wall, so you fix the wall instead of chasing browsers with discounts. If you run NPS for ecommerce, it’s the same idea applied earlier: measure the moment, act on the reason.
When to trigger it: the three moments
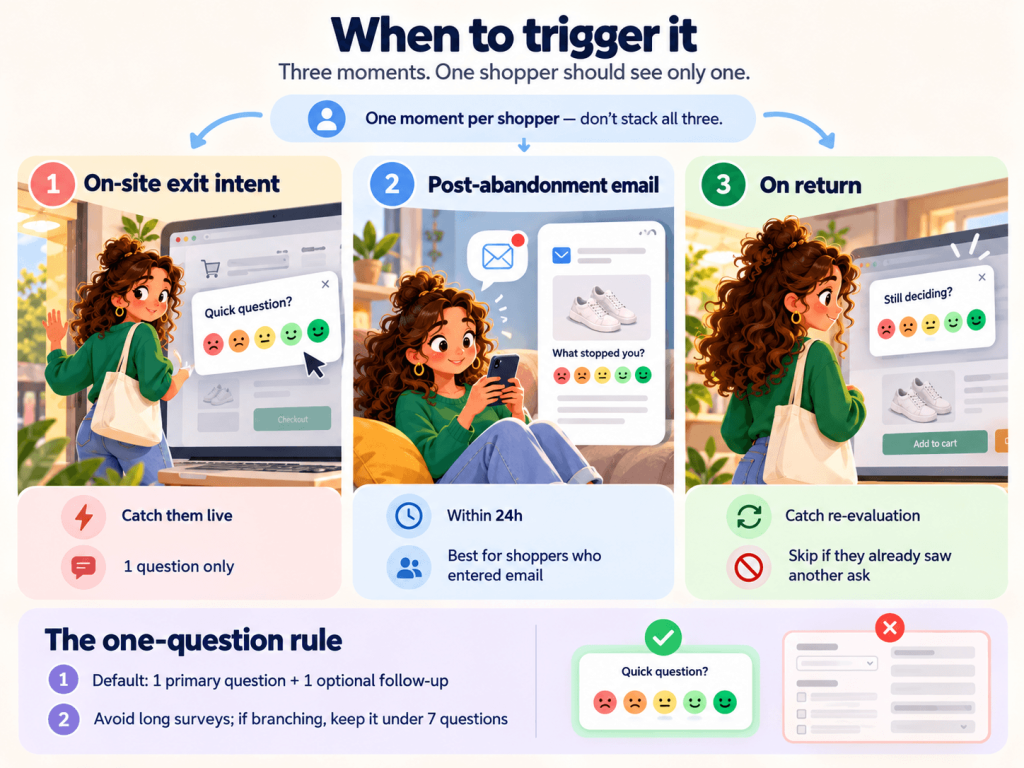
Timing decides whether anyone answers. Three moments are worth surveying an abandoner, each with a different ask. The mistake is stacking all three on one shopper, which turns a question into harassment.
On-site exit intent (catch them live)
This fires on the cart or checkout page the instant a shopper moves to leave, when the reason is freshest and patience is lowest, so you get one question. Retently supports it as a native on-exit-intent website trigger, so you can pop a single-question survey on the checkout page without writing code.
Post-abandonment email, within a day
Miss them live and the abandoned-cart email is your second window. The boundary matters here: the email rides your store or ESP’s existing abandoned-checkout flow, the one Shopify or Klaviyo already sends. You drop the one-question survey into that email, or trigger it via API or webhook, and Retently collects and routes the response alongside everything else. There’s more room here and a lower response rate, so it suits a plain “what stopped you?” ask. The email only reaches shoppers who entered their address before leaving; everyone who left earlier can only be reached on-site.
On return
Some shoppers return without buying. A single prompt, “still deciding? what’s holding you back?”, catches them mid re-evaluation. The rule holds: one moment per shopper, so if they saw the exit-intent question, skip the email survey.
The one-question rule
The best thing you can do for response rate is counterintuitive: ask less. These shoppers have already declined, and every field is another reason to close the tab.
So the default is one primary question and at most one optional follow-up. The common anti-pattern, visible in plenty of published question banks, is a sprawling survey with ten or eleven categories at once: price, shipping, product, device, reviews, returns, and account creation. That belongs on a post-purchase survey, where the customer has committed. For someone halfway out the door, it’s the fastest route to zero answers. If you must branch, keep it under seven questions total, and only ask the follow-up that the first answer earns.
The question bank
Here’s the part you can copy. The whole survey is one well-chosen question and, optionally, one follow-up. The answer options matter more than the question wording, because those options are what you rely on.
The primary question (pick one)
Use a closed multiple-choice question, so answers are instantly countable:
What stopped you from completing your order today?
- The price or shipping cost was too high
- My payment method wasn’t available
- I didn’t trust the checkout with my card details
- I wasn’t sure about sizing, fit, or the product
- Something went wrong at checkout
- I was just browsing / not ready to buy
Those six aren’t arbitrary: each maps to a distinct root cause and fix, turning a pile of responses into a to-do list. To weigh multiple-choice against open-ended or scale formats, our breakdown of survey question types covers the trade-offs.
The optional follow-up
If you add a second question, make it earn its place: either an open-ended “what would have convinced you to buy?”, or a conditional branch, so “didn’t trust the checkout” gets “what would have made you feel safer?” Never both.
If you branch, one line per answer covers every option, shown only to the shopper who picked it:
- Price or shipping too high: “What would have felt like a fair total?”
- Payment method wasn’t available: “Which payment method did you expect to see?”
- Unsure about sizing, product, or returns: “What information was missing?”
- Something went wrong: “What happened, and on which device?”
- Just browsing or Other: no follow-up. Thank them and stop.
Templates by trigger
The wording changes with the moment, the question doesn’t.
Exit-intent, on-site: “Before you go, one quick question: what stopped you from completing your order today?”
Post-abandonment email: subject “Quick question about your order,” body “We noticed you didn’t finish checking out. Mind telling us what got in the way?” with the options as tappable links.
On return: “Welcome back. Still deciding? What’s holding you up?”
Keep the voice plain: no urgency, no guilt. You’re asking a favor from someone who already said no.
Turn answers into fixes: the routing map
Collecting reasons is easy; the value is in the routing. Every answer points to a specific fix and follow-up channel. Here’s the map, one row per answer:
| Answer | Likely root cause | Store fix | Follow-up channel |
|---|---|---|---|
| Price or shipping too high | Fees appear late, or shipping crosses a threshold | Surface costs earlier; test a free-shipping threshold | Recovery email with a shipping offer |
| Payment method missing | Checkout lacks an expected wallet or financing | Add digital wallets and buy-now-pay-later | None; it’s a build fix |
| Didn’t trust the checkout | Weak trust cues at card entry | Add security badges, reviews, clear return terms | Email leading with guarantees and social proof |
| Unsure about sizing or product | Product page left a doubt unanswered | Add a size guide, richer detail, customer photos | Email with fit guidance or reviews |
| Something went wrong | A technical or usability fault | Audit the failing step, device, or browser | Apology-and-recover email after the fix |
| Just browsing / not ready | No obstacle; low intent this visit | Don’t discount; nurture instead | Standard nurture, no urgency, no code |
Pass device, new vs returning shopper, and cart value along with each response, so you can cut the mix by segment. Shipping complaints from first-time mobile buyers and from returning customers need different fixes, and a single combined share hides that.
A few fixes deserve their own playbook. When “didn’t trust the checkout” recurs, the answer is a deliberate stack of trust signals at checkout, not one badge. When “something went wrong” spikes, you’re looking at checkout UX mistakes, a structured audit will surface. Repeated shipping-cost answers point back at your delivery experience. The row not to fight is the last: discounting a browser trains your best customers to wait for a code.
Measuring whether it’s working
Judge the program on three things. First, response rate: a declined-intent audience means a low single-digit rate is normal, not a failure. Second, theme share over time. If shipping cost was 30% of answers in month one and you fixed your threshold, that share should shrink. Movement in the mix means your fixes are landing. Third, recovered revenue, traced properly: survey reason, then the fix you shipped, then the abandonment-rate change for that segment.
There’s a longer payoff, too. Fixing what abandoners tell you feeds the same engine that drives repeat purchase. In our first-party analysis matching NPS responses to order histories across Shopify stores, Promoters repeat-purchase at a median 1.35x the rate of Detractors (24-month window, 2026). That’s a correlation, not a promise, but the direction is clear: a smoother checkout makes more satisfied buyers, and they come back. Once they buy, reach for a post-purchase survey. To decide who’s worth winning back, RFM and repeat-purchase segments show where to focus the effort.
The cheapest diagnostic in your checkout stack
Everything in your checkout funnel costs money to change. A survey costs one question. Ask it at the right moment, keep it to a single tap, and route every answer to a fix, and you swap guesswork for a ranked list of things to repair. That beats another A/B test aimed at a problem you haven’t confirmed.
Retently fires the on-exit-intent survey natively on your checkout page and routes every response into one place. See where your shoppers actually stall. Start a free trial or book a demo to set it up.
Frequently Asked Questions
What is a typical cart abandonment rate? The most cited benchmark is 70.22%, averaged across 50 studies by the Baymard Institute It’s a broad average, not a target. Rates vary by category, so your own store’s baseline is what matters.
When should you send a cart abandonment survey? Two moments work best: on-site exit intent on the cart or checkout page as the shopper moves to leave, or inside the abandoned-cart email your store already sends within a day. Don’t stack both on one shopper.
Why do customers abandon carts? In 2026 Baymard’s data, the top reason is just browsing and not ready to buy, at 42%. Among those with a concrete obstacle, 40% cited extra costs such as shipping and taxes, 19% didn’t trust the site with their card details, and 18% objected to forced account creation.

 Christina Sol