Over the last decade, Net Promoter Score® has gradually become the new standard for measuring customer loyalty and satisfaction, not just for startups but for businesses around the world.
Popularly labeled as the “ultimate question”, the NPS® survey has made the long customer satisfaction surveys obsolete (for good!), introducing a new, simple and convenient way for businesses to measure customer happiness.
But despite its widespread adoption and incredible simplicity, experts worldwide have argued that the system has inherent flaws. From not providing actionable metrics to having high statistical variance, NPS has been criticized for painting an inaccurate picture of customer satisfaction.
In this article, we explore some of the biggest criticisms of the Net Promoter Score and understand why it has failed to deliver favorable outcomes for a few brands.
-
It’s a survey of feelings
NPS cannot be considered a quantifiable metric since it calculates how many users are “likely to refer your brand”, not how many users “actually referred your brand”. It’s a leading indicator of your brand’s referral propensity, measuring the “inclination” of customers to refer (feeling), instead of telling you how many people did refer (analytics).
For instance, you may have an NPS score of 70, but your brand Promoters are less active in boosting your brand through referrals; while your competitor with an NPS score of 40 is driving more referrals, traffic, and, therefore – sales.
Of course, if you had to create a framework that tracks the actual number of referrals every customer makes and compare that with how they feel about your brand, it would likely be much more complex than implementing NPS.
But since there’s no way to actually tie up the number of referrals a customer makes with the number of referrals they intended to make, it’s safe to say that NPS captures emotional responses and can, therefore, be termed as a “survey of feelings”.
-
You cannot slice and dice the data
NPS is a simple metric that lets you measure customer happiness and brand loyalty. However, its simplicity can be a serious limitation for businesses that have no clear way of interpreting the number.
For example, let’s say your business had an NPS score of 50 the previous year, which increased to 55 recently. Now, from a statistical viewpoint, it looks like you have a net 10% YoY increase, which is great. But, it gives you no insights into why it happened.
For example, if your website visits went from a thousand to a million in a couple of weeks, you could drill down on the location, type of traffic, the specific pages users visit and the search terms they look for, to understand what’s driving the trend.
What can you make out from the fact that your NPS increased 10% YoY? Can it be co-related with your net increase in sales or profits? If yes, on what basis would you establish that relationship? If NPS measures customer happiness, why are customers happier this year? The number alone provides absolutely no answers.
To address this limitation, businesses ask a follow-up open-ended question after capturing the NPS feedback score, like, “What is the most important reason for your score?”
Some NPS services offer segmentation features, allowing you to break down the score for a particular customer group within your business. Typically you’ll be able to sort them by criteria like plan type, account creation date, location, and more. This tailored approach helps pinpoint which segments might be pulling your score down and what the key drivers of your business are.
-
It has a weak audience orientation
If you’re running a B2B business, capturing responses for NPS surveys can be a little tricky, since there’s no clear way of identifying the client’s actual perception. Different departments can engage with you at the same time, and have entirely different opinions about your product/service.
For example, a junior executive in the customer service department might give your product a 9 on the survey, but a senior management executive can give you a 5 or 6. Whose opinion matters more to you?
Without appropriate segmentation, NPS surveys can inaccurately aggregate user opinions, thereby questioning the credibility of your NPS.
As we’ve mentioned above, you can solve this problem by segmenting your customers based on their job titles. Isolate the NPS for each department to find out their level of satisfaction and learn what obstacles they faced throughout the process.
With these valuable insights on hand, you can prioritize your challenge areas and improve customer experience for those departments.
-
You need to be mindful of the geographical areas
Most businesses miss out on this one.
Apart from segmenting opinions based on individual departments, you also need to be mindful of the regional differences, as taking the NPS score on an absolute basis can paint a very wrong picture of the market.
For example, European customers are generally much more passive than American customers, even though both really like the product.
So, you can have an NPS score of 60 in America and only 45 in Europe, but that still does not imply that you’re doing badly in Europe. It just means that Americans and Europeans don’t express their referral propensity the same way.
Age, gender, and socio-economic status can also influence how customers respond to NPS surveys. Younger customers might be more tech-savvy and have higher expectations for digital experiences, whereas older customers might place more value on traditional customer service. These demographic differences can impact how likely different groups are to recommend your brand, skewing the NPS results.
Since NPS captures how people feel rather than how they act, you need to consider the region’s demographics and adjust the NPS score for variations, before drawing any conclusions.
-
Get your survey timing right
Although NPS has gained popularity as “the ultimate question” that replaces long customer satisfaction surveys, it still has to be asked in the right context to capture unbiased user opinions.
Depending on how it’s implemented, NPS popups can either increase engagement or annoy users. For instance, you don’t want to ask users who have just onboarded your product whether they would recommend it (they just don’t know it yet!). But as you go further down the funnel, you might want to figure out the best moments to ask the question.
For example, suppose you ask your customers whether they would recommend your product while they’re waiting for an output (loading/processing screen) or just after they had a delightful experience (order completion page). In that case, there are chances that you would capture honest responses. But if you’re going to pop that question while they’re in the midst of an important workflow, they’re going to close the pop-up and forget about the survey.
If you decide to use a non-obtrusive pop-up or text banner, only those customers who have used your product long enough will be able to notice the difference. For the majority of users, the change will be unnoticeable, thereby skewing your result set.
Considering how timely NPS pop-ups need to be in order to capture honest emotional responses, some businesses use emails to send NPS questionnaires, so that users can fill it in at their own convenience.
The downside of using email to send NPS surveys is its low response rate, which is around 20-30%. However, there are NPS services offering advanced features that can help you increase the response rate.
One of them is sending the survey in your customer’s timezone, as well as resurveying – resending your NPS survey to customers who didn’t open it.
Even emails can capture varied responses since NPS is a survey of feelings. It’s possible that instead of reflecting on the actual experiences, people are driven by their mood (happy, sad, or angry), when they hit the reply button.
Also, if you’re only using emails to conduct NPS surveys, you’re limiting your audience to users whose email you have or who have opted in for your emails and hence open them (brand Promoters), while not capturing responses from those who don’t engage with your product (brand Detractors) or don’t open your emails (Passives).
Perhaps the best way to overcome this emotional barrier is to identify channels with a higher response rate within your industry and focus on interactions that are less critical and highly interactive.
-
There’s no uniform NPS Benchmark
NPS does not have a uniform benchmark. For instance, if your growth rate is 20% or your SEO page rank is 3, you know how you compare to other companies globally. But can the same be said about NPS?
According to Retently’s NPS benchmarks, the average NPS score for Healthcare over a 5-year period is 34, with the lowest being 20, while the average NPS score for Communication & Media providers lies in the range of 19, with the lowest being -6.
Therefore, you cannot say a lot about a company just by looking at its absolute NPS score, without considering the relative performance within the industry. It’s imperative to close the loop and understand why your customers gave you the feedback.
For instance, customers who visit department stores have less critical and highly interactive shopping experiences. If the department store next door is closed for the weekend and you can’t get your groceries, you won’t get angry.
But what if your Internet connection was down for the weekend due to maintenance issues? Since ISPs are delivering highly critical, highly interactive experiences, even a minor outage of a few hours can piss off the customers.
That being said, even within the same industry or product vertical, NPS is problematic to interpret, since there is more than one way to get the same number and different factors may affect the NPS benchmarks.
For example, let’s assume that two businesses in the same vertical have an NPS score of 20. Would you consider both companies to have delivered the same level of customer happiness, especially when the first business could have 20 Promoters, 80 Passives, and 0 Detractors, while the other could have 60 Promoters, 0 Passives, and 40 Detractors? Would it be fair to equate a business that has 40% Detractors with the one that has 0% Detractors?
I don’t think so.
-
It’s statistically challenging to be consistent
While there’s a great advantage to measuring your NPS on a periodic basis, getting an accurate NPS can be statistically challenging since you need a lot of responses to reduce your variance to a minimum level.
Mathematically speaking, NPS equals the percentage of Promoters (9s and 10s) minus the percentage of Detractors (0s to 6s). Now, since we’re subtracting two values with high statistical variance and eliminating the middle-pack Passives (7s and 8s) altogether from the calculation, the individual readings can become spread out, leading to inaccuracy in calculating the NPS score.
Most brands make the mistake of surveying all their customers only once or twice a year and don’t expand their sample size steadily to reach every customer. The result? They capture feedback with a high degree of response bias, which leads to an irrelevant NPS score.
To ensure a statistically significant NPS survey, you need to schedule NPS surveys throughout the year and work towards increasing your response rate.
It can be done by starting with a small subset and then systematically surveying all your customers. Emails are an excellent survey channel choice to increase coverage and consistency, as they’re non-intrusive and can be auto-scheduled to maximize user participation.
-
Most companies don’t know what to do with it
Ever since, Fred Reichheld, a partner at Bain & Company, created a new and simple way of measuring how well a business treats its customers, it has evolved from being a loyalty metric to a completely new management system that puts the customer at the center of organizational goals.
But for most organizations, when looking to leverage the power of NPS to reduce customer churn and dissatisfaction, the lack of a customer success framework can be a real issue. Most companies simply don’t know what to do with the data.
For example, if the sales are down by 20%, businesses usually know how to formulate an execution plan. But do they have an actionable plan for NPS going down by 20%?
As most businesses can’t formulate actionable strategies and don’t have a framework to accommodate the results, NPS surveys become largely ineffective in driving organizational change and improving the impending outcomes.
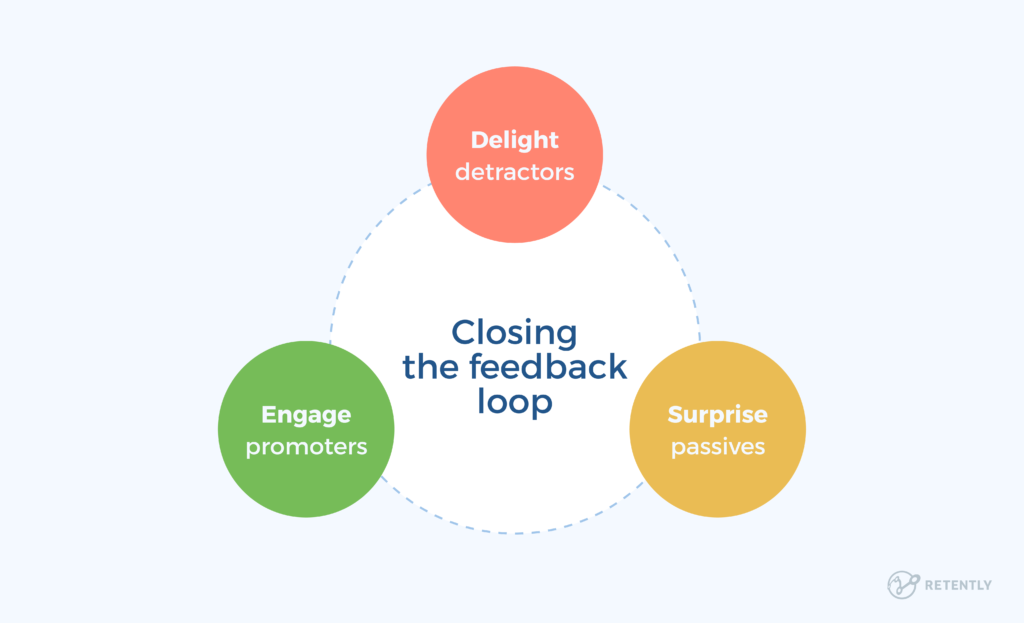
Whereas what they need to be focusing on is closing the customer feedback loop. The goal is simple – delight Detractors by fixing the problems they highlighted, surprise Passives to win their loyalty and engage Promoters by giving them the means and instruments to do it.
Impact of misinterpretations and misuse
While the Net Promoter Score is a widely used tool for gauging customer loyalty, its power can be significantly diminished when misinterpreted or misused. This can lead to:
1. Misguided business decisions
When businesses put too much stock in their NPS, it can lead to some pretty skewed strategies. For example, a company might focus intensely on converting Detractors to Promoters, investing heavily in promotions or changes that affect only a small segment of customers. Meanwhile, they might neglect broader service improvements that could benefit a larger customer base, including those who didn’t respond to surveys. Another scenario is when companies interpret a high NPS as an all-clear signal, neglecting innovation or addressing underlying issues.
2. Manipulated results
There’s also a temptation to game the system. Because NPS can influence perceptions of a company’s performance, some might try to manipulate outcomes to paint a rosier picture. This can be done by selectively gathering feedback from customers believed to be Promoters or by framing the question in a way that nudges them toward giving a higher score. While these tactics might boost NPS in the short term, they risk damaging credibility and customer trust in the long run.
3. Impact on employee performance
Linking employee incentives directly to NPS scores can have unintended consequences. On the one hand, it might motivate staff to improve customer service; on the other, it can lead to frustration and burnout. This is relevant for situations where employees feel they have limited control over the factors that influence customer responses, such as product quality or pricing.
Understanding these Net Promoter imperfections can help businesses use the metric more wisely. It’s not just about collecting a number but understanding what that number represents and what it doesn’t. By being aware of the metric’s limitations and the impact of its misuse, you can better align strategies with customers’ true sentiments.
Wrapping-up: Counteracting Net Promoter imperfections
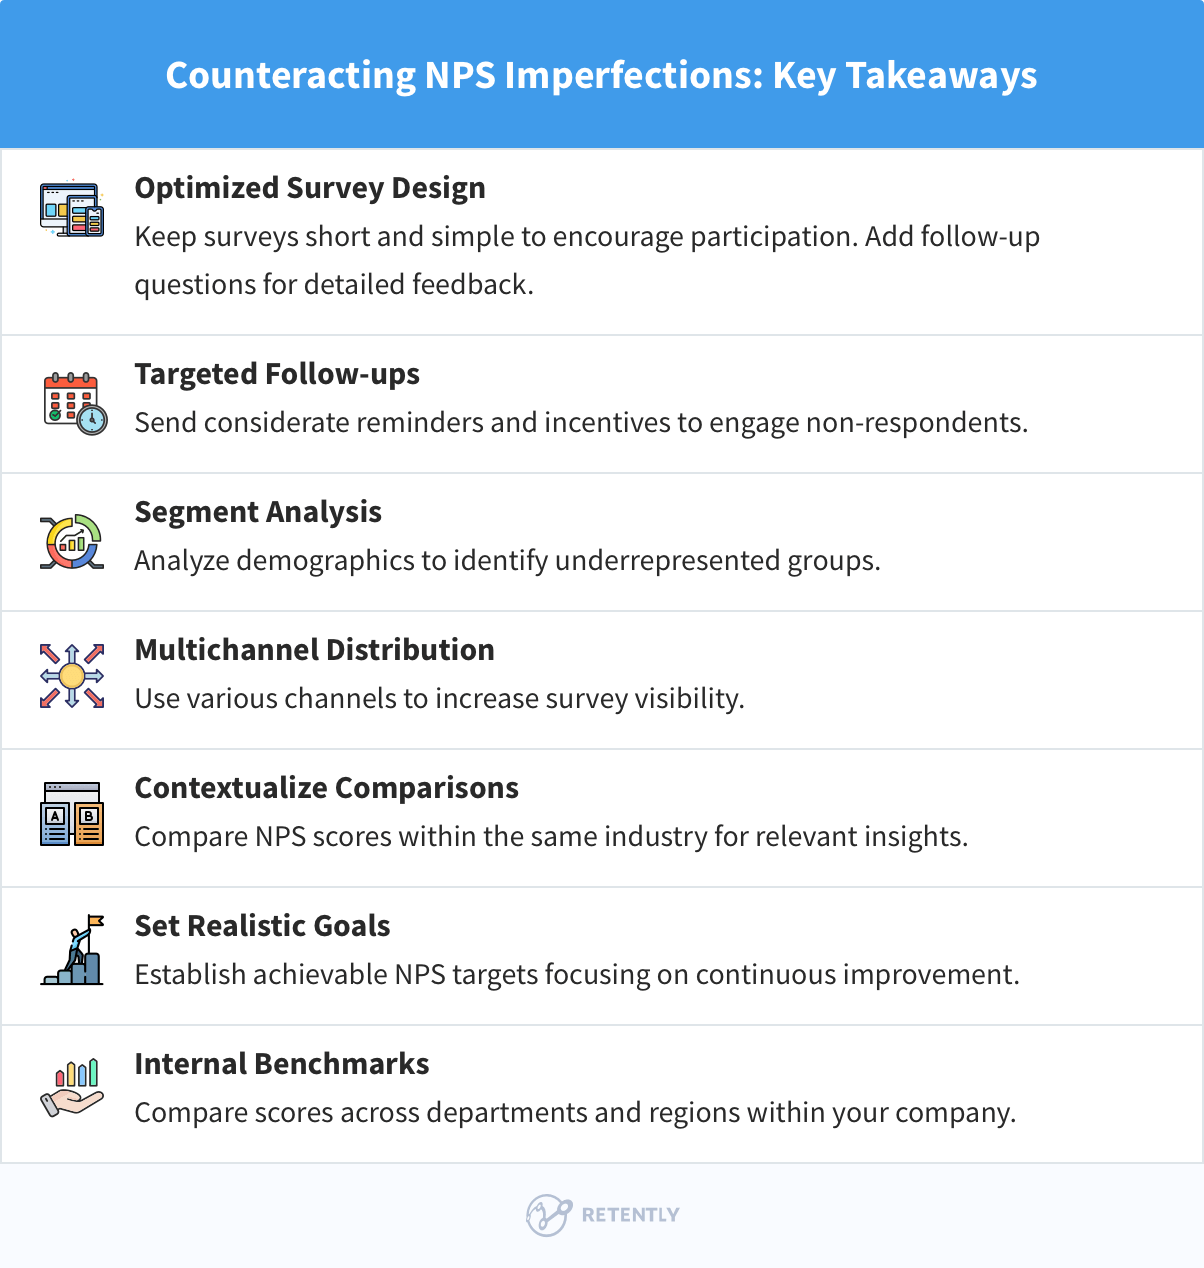
To help you navigate these challenges and enhance the effectiveness of your customer feedback strategy, here are some key takeaways along with actionable steps you can implement to counteract NPS imperfections:
- Optimized survey design: Keep the survey short and straightforward to encourage more customers to participate. Add a few follow-up questions to gather more detailed feedback without overwhelming respondents.
- Targeted follow-ups: Reach out to non-respondents with reminders and incentives to participate. Ensure these follow-ups are respectful and considerate of your customers’ time.
- Segment analysis: Analyze the demographic and behavioral characteristics of respondents and non-respondents. This can help you identify underrepresented groups and tailor your survey approach to better engage them.
- Multichannel distribution: Distribute the survey through various channels (email, SMS, in-app popups) to increase visibility and reach a broader audience.
- Contextualized comparisons: When benchmarking, compare NPS scores within the same industry or segment to ensure relevant and meaningful insights. Use these benchmarks as reference points rather than strict targets, and consider the unique factors that influence customer satisfaction in your specific context.
- Realistic goals: Set NPS targets that are ambitious yet attainable, based on a thorough understanding of your current performance and customer feedback. Focus on continuous improvement rather than merely hitting a specific score.
- Internal benchmarks: Consider creating internal benchmarks by comparing NPS scores across different departments, regions, or time periods within your own company. This can provide more relevant insights and highlight areas for improvement that are directly within your control.
Does it still make sense to know Your NPS score?
Despite the above-discussed limitations, it still makes sense to integrate NPS surveys in your feedback loop, for the simple reason that not having any feedback is not always a good sign.
If you don’t capture how users feel about your brand, you’re not measuring how happy your customers really are with your product or services.
Considering the fact that 95% of buying decisions are driven through emotions, and not rationality, capturing how users feel about your brand is vital for long-term sustainable growth. While the Net Promoter System certainly has its own imperfections, most of them can be overcome through proactive implementation and predefining actionable metrics.
Given the strengths and limitations of each metric, a multi-metric approach is often the most effective. Combining NPS, CES, and CSAT can provide a comprehensive understanding of customer loyalty and satisfaction. For example, while NPS measures long-term loyalty potential, CES can help identify friction points in customer interactions, and CSAT can gauge short-term satisfaction after specific engagements. Together, these metrics can offer a more complete picture and help businesses prioritize improvements that truly enhance customer experience.
Retently makes it easy to measure your brand’s NPS score and link it to other customer satisfaction metrics. With quick installation and easy-to-follow documentation, you can now get actionable insights on how to reduce customer churn, grow revenue, and build long-term customer happiness. Sign up for a free trial to start measuring your customer satisfaction.




 Alex Bitca


 Greg Raileanu

 Christina Sol