


 Alex Bitca
 ")
Typeform is a beautifully designed framework to create engaging surveys, online forms, quizzes, landing pages and much more. With over a million users across the globe, the dynamic SaaS software is being used by some big brands like Apple, AirBnB, Uber and Nike.
At the Customer Success Summit 2016 [VIDEO], David Apple, Director of Customer Success, Typeform, explained how they created a scalable, automated setup to collect and act on their NPS feedback. Due to their highly successful NPS implementation, Typeform was able to identify the key factors that drove customer loyalty and narrow down on customers that were most likely to churn.
In this article, we’ll be explaining in detail how Typeform successfully implemented their NPS framework, and how they used the qualitative metrics to create an actionable strategy for improving customer satisfaction and their product roadmap.
Splitting NPS into a 2-question survey
NPS has been widely popularized as being the ultimate question that quantifies customer satisfaction and loyalty.
Instead of asking multiple questions, the simple survey just asks a single question: “On a scale of 1-10, how likely are you to recommend us to your friends/colleagues?”
Based on their individual responses scores, the customers are segmented into three categories:
Promoters: 9-10 (Customers who love your product)
Passives: 7-8 (Customers who might easily churn)
Detractors: 0-6 (Dissatisfied customers)
Subtracting the percentage of detractors from the percentage of promoters gives us the NPS, which ranges from -100 (every customer is a detractor) to +100 (every customer is a promoter). You can think of NPS as your customer balance sheet – the higher the score, the better customer retention and customer lifetime value you’ve got
But there’s a problem with having such a simplified metric. As Net Promoter Score is just a number, you cannot slice and dice it to reveal further insights.
For instance, if you have an NPS of 50, you know you have 80% promoters and 30% detractors, but you don’t know why 30% of your customers are not happy with your product experience.
That’s the reason Typeform split the NPS into a 2-question survey. After asking customers their likelihood to recommend (LTR) score, Typeform also asked a follow-up question to understand why the customer gave that score.
For example, if a customer selects a score between 0-6, Typeform asks customers the reason for their dissatisfaction. Similarly, if a customer scores between 9-10, they ask them to enlist the best features of the product.
The design imperative behind creating the follow-up question is simple. It allows Typeform to capture personalized qualitative feedback based on the LTR score while building up engagement with their customers.

Crafting the respondents’ list
After setting up their 2-question NPS framework, Typeform decided to filter the target audience for their NPS survey.
Instead of sending the survey to everyone, Typeform limited their survey audience to only 11,000 customers, with the sampling done by mixing up free and premium users. The idea behind mixing up two segments was to eliminate selective response bias and compare the satisfaction levels of both customer categories.
For example, had Typeform only measured the NPS of their premium customers, it would have never understood the bottlenecks that prevent customers from shifting to a premium plan. Similarly, if they had only surveyed their free users, they would have failed to re-engage with their paying customers and understand their motivation or frustrations.
To further improve the quality of the captured feedback, Typeform decided to include only the most active users in the survey list, as they felt they could get more relevant insights from them. With the expectation that they would get at least a 7% survey response rate, they kicked off their first NPS campaign.
Understanding the workflow

After deciding their target audience and NPS questionnaire structure, here’s how Typeform set up their NPS workflow:
1) First, Typeform sent the NPS survey to around 11,000 active users, both – free and premium via email. The email included only one question- “How are likely are you to recommend Typeform to a friend?”. When customers clicked on a score, the form redirected them to the follow-up question, where they were asked the reason for their LTR score.
2) If the LTR score was in the range of 9-10, Typeform thanked them for the feedback and asked them to share their Typeform experience with their friends via Twitter.
3) Each successful submission also created a ticket in Zendesk, so that Typeform Customer Success team could follow-up on customers and have 1-on-1 interactions. The qualitative feedback received from the customers was tagged in Zendesk for further analysis.
4) Using a hidden field in the form, Typeform also captured the email address, geographical location, type of plan (free or premium) and other vital customer statistics, and pushed them into their internal reporting tool for analysis.
Survey outcome
Once the NPS workflow was set up, Typeform decided to execute it. They sent out the survey to their sample list and waited for a few days to analyze the feedback. Here’s the outcome of the survey in a nutshell:
Positives:
1) The survey got a 14% response rate (double than expected), with most users responding within the first two days.
2) The Tweets shared by the brand promoters generated 100+ new signups.
3) The positive feedback received from the customers was immensely motivating for the team.
4) They were able to respond to every customer with a personalized follow-up email in a span of just two weeks.
Negatives:
1) While Typeform had a decent conversion rate of around 24%, nearly 58% of the users bailed out on completing the survey after being redirected to the follow-up question, which means Typeform failed to collect around 42% of the feedback.
2) Although they sent a personal email to each of their customers, very few customers re-engaged with them after the email.
3) Since every submission created a new ticket in Zendesk, it messed up their Zendesk metrics and it became challenging for the support team to keep up with the inflow of tickets.

Automating the workflow
To eliminate the underlying bottlenecks with the previous workflow, Typeform decided to refine the workflow even further, so that they can capture more detailed insights, re-engage with customers and improve their survey’s statistical significance.
Here’s how they improvised on their initial workflow:
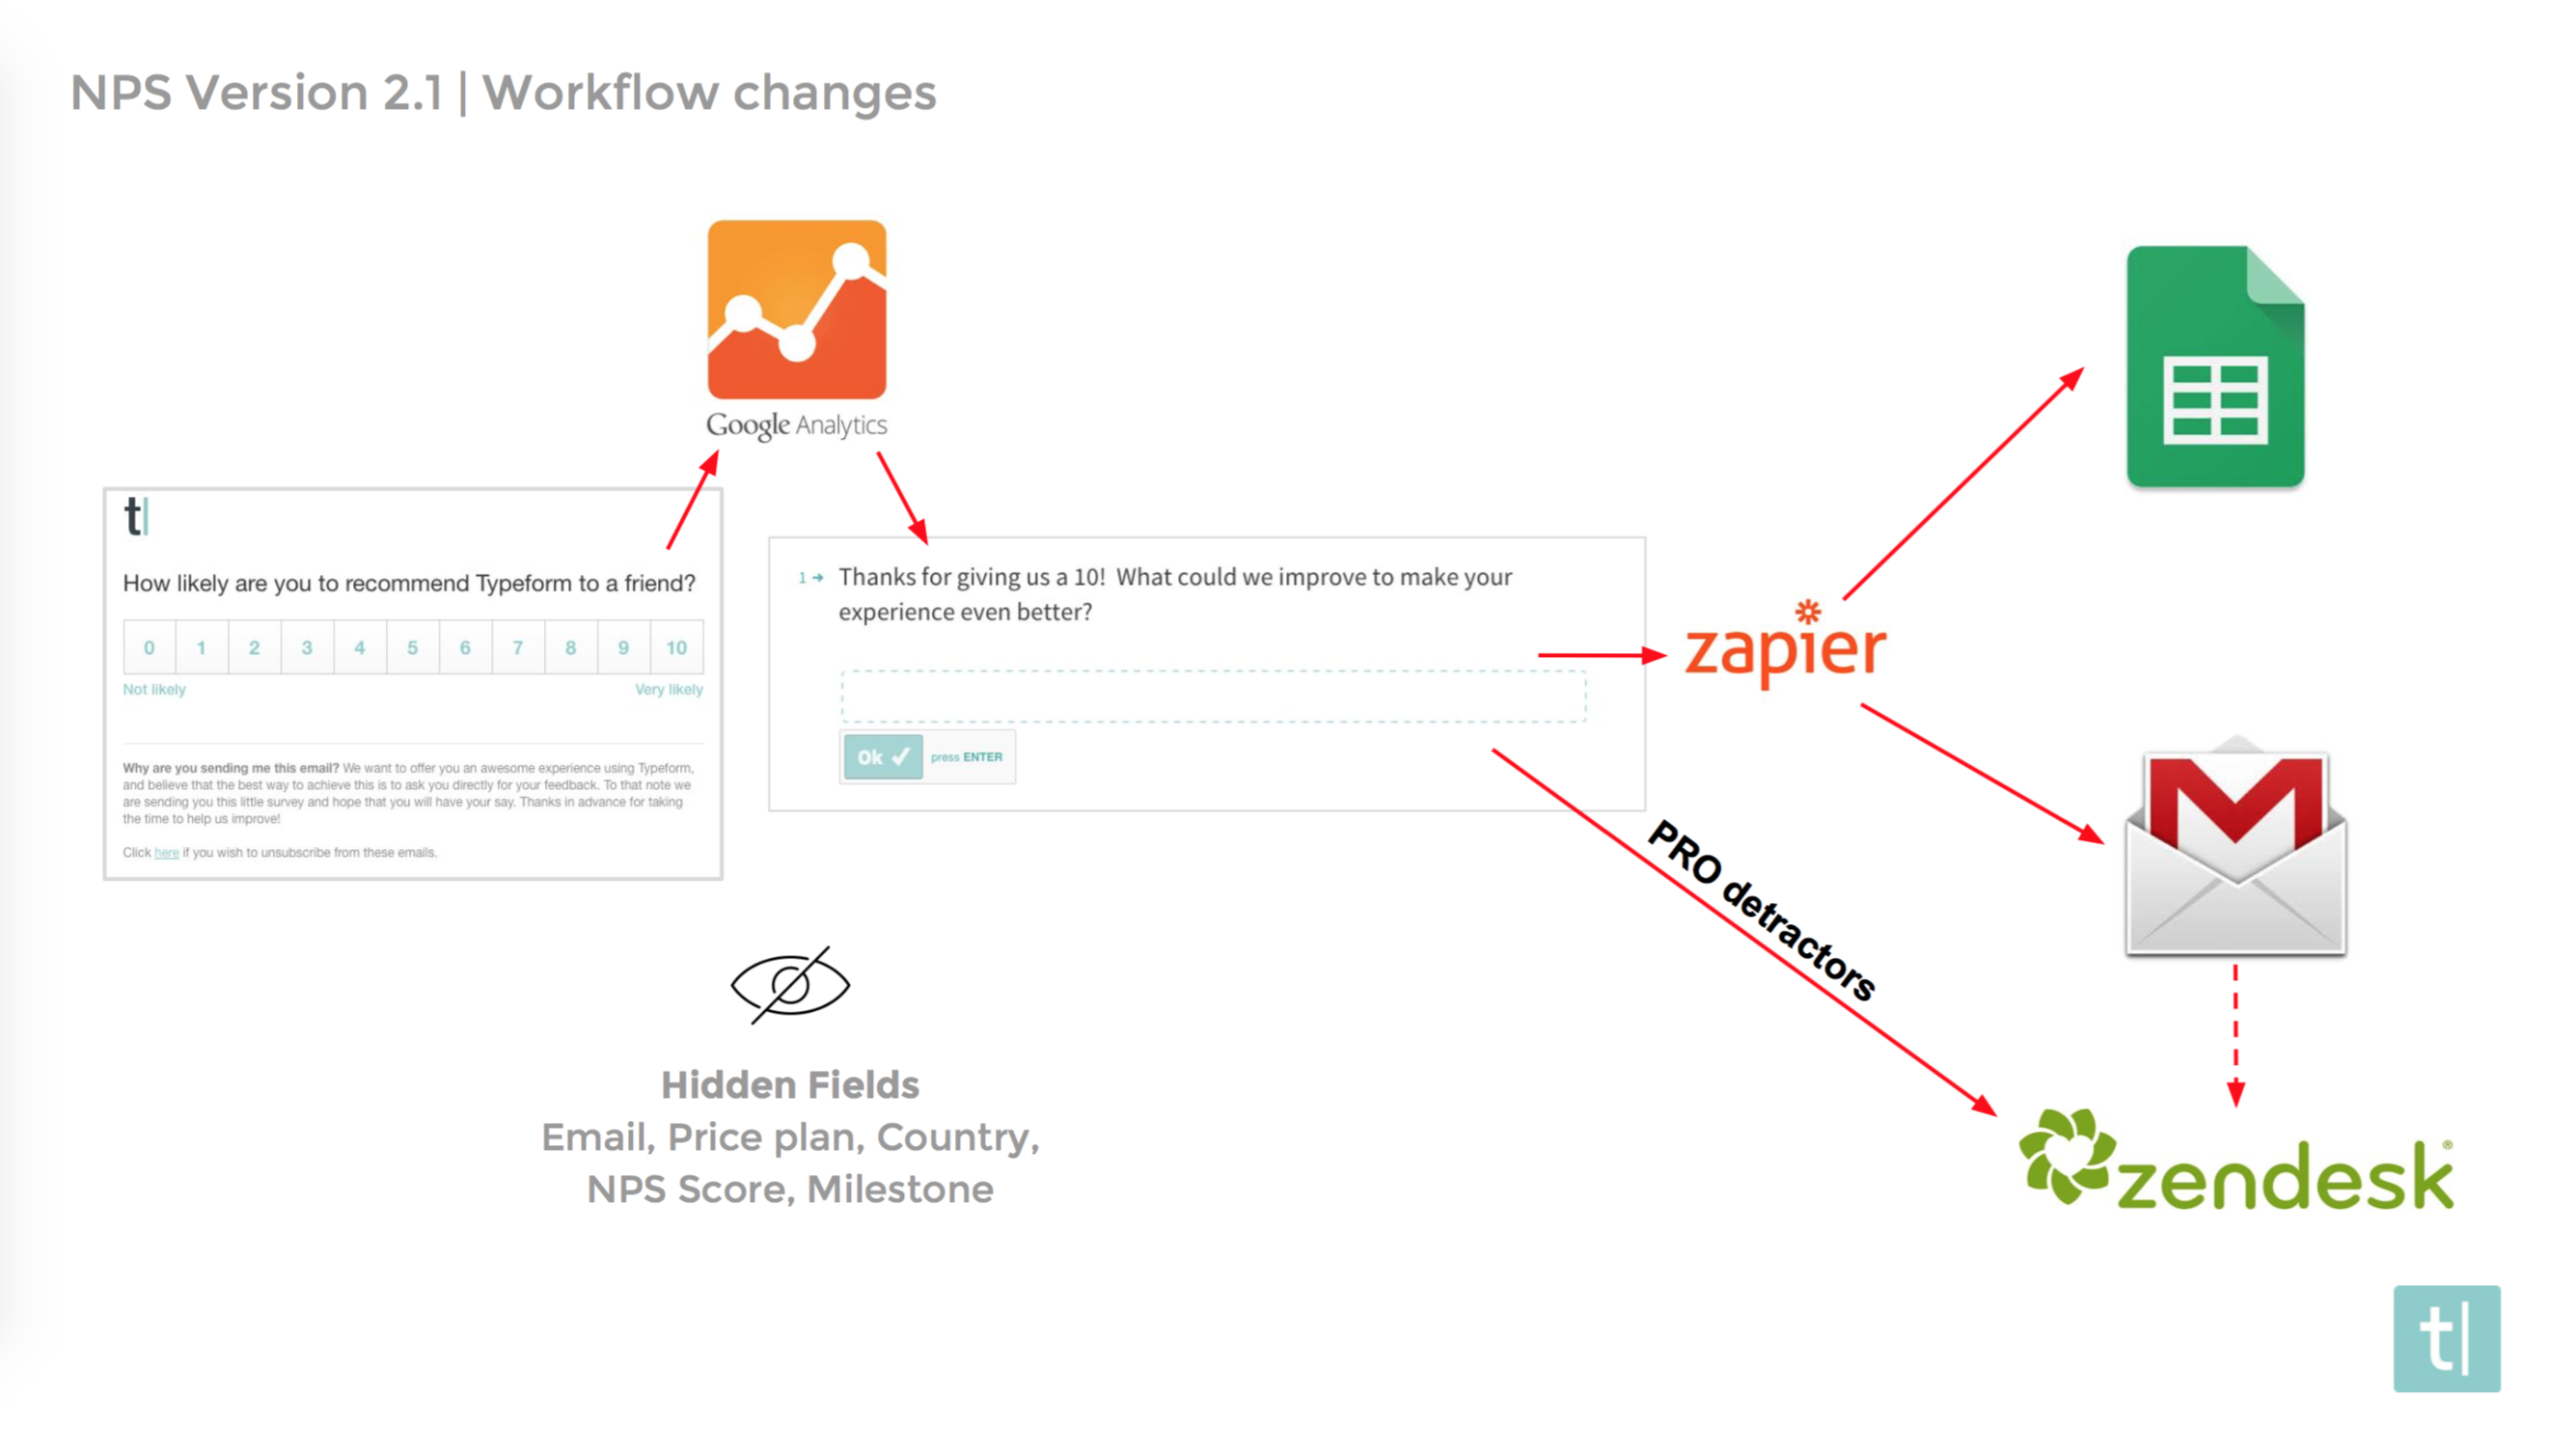
1) Instead of tracking NPS after the follow-up question, Typeform used Google Analytics to capture the LTR score. When a customer clicks on a number in the email, the LTR score first gets recorded into Google Analytics, following which the user gets redirected to the follow-up question. With this simple change, Typeform was able to eliminate the 42% drop in collecting feedback.
2) Next, they added one more hidden field named Milestone, which tracks if the customer gave the feedback one month after signup or six months after signup. The metric would help Typeform in assessing how the NPS varies over customer lifecycle.
3) After the customer submits their qualitative feedback, Typeform uses Zapier to send the data into a Google spreadsheet, where it gets tagged appropriately. The sheet is then passed on to the product, sales or marketing team for further analysis.
4) Based on their individual feedback scores, Typeform created a personalized email that was automatically sent to the customer, once they completed the survey.
5) Further, instead of creating a Zendesk ticket on every submission, Typeform refined the workflow to only create support tickets when a user responds to the automated email. With this simple workflow modification, they were able to reduce the number of support tickets generated in Zendesk, while prioritizing customers who need help and want to have a 1-on-1 personal interaction.
6) In order to reduce customer churn due to non-responsiveness or passivity of the user, Typeform created an additional trigger in the workflow to automatically send the NPS survey to pro users, twenty days after they upgrade. In case these pro users send a low LTR score, the workflow immediately created a ticket in Zendesk, and assigned it to someone in the customer support team.
The automated NPS workflow set up by Typeform worked like clockwork, capturing qualitative feedback for the product team and automatically triggering conversations with the right customers to reduce customer churn. Since there was little manual effort required, Typeform was able to scale the program to thousands of its users, without impacting the operating margins or degrading the customer experience.
Creating an Action Plan
So far, we have seen how Typeform automated the NPS workflow to reduce manual inputs and improve the statistical significance of the survey. But what good is the captured qualitative feedback, without an actionable strategy?
For instance, if you have a Net Promoter Score of 39, what does that imply? How do you know if your paid customers are happier than they were before? Or, if you have captured a lot of qualitative feedback from your customers, how do you analyze which customer requests need to be prioritized and converted into a product feature?
In order to simplify decision making and improve customer targeting, Typeform derived their actionable metrics by mapping NPS with contextual user information. Although these metrics vary depending on the underlying business model, you can take cues from Typeform’s NPS metrics to formulate your own.
Segmenting the feedback
Typeform divided their user-base into individual segments to better understand the underlying reason for their Net Promoter Score.
For instance, by segmenting users according to their plan, Typeform found that PRO users were more loyal than overall users, indicating that plan upgrades directly resulted in improved customer satisfaction (a positive indicator).

Another interesting metric that Typeform used was segmenting the score by milestone.
For instance, Typeform found that the average NPS for customers after 1 month of sign up was 33, which increased to 37 after six months. In other words, customer satisfaction grew over time, which indicated that people who used Typeform more were more satisfied.

But, since the milestone metric did not consider the same customer over a given timeframe, it could also imply that customers were simply more engaged after six months than before.
To eliminate the bias, Typeform tracks the NPS of every customer one month after they sign up, and six months after they sign up. If the NPS increases or stays constant over time, it’s a strong indicator of improved engagement and customer satisfaction.
Tagging qualitative feedback
Apart from segmenting the aggregated data, Typeform also tagged the qualitative feedback to get accurate insights into customer motivations and issues.
For instance, after tagging the positive qualitative feedback received from their paying customers, Typeform could analyze the primary reasons why people loved their product.

Similarly, the tagged negative feedback from paying customers provided the most interesting insights for the team, as it allowed them to narrow down on customer pain points. For instance, the below graph shows that a majority of negative feedback was either new feature requests or problems with multiple fields.

By quantifying the qualitative feedback, Typeform was able to get a quick overview on how to plan their product roadmap. For a better understanding of the tagged feedback, Typeform also tied the NPS data with other internal data sources, and created a dashboard called “Customer Voice”.

The dashboard clearly outlined the top feature and build requests, while also highlighting the major customer pain points. It also tracked the creation of support requests, so that the product team could easily analyze whether the new feature actually improved customer satisfaction or backfired by generating more support tickets.
Cross-checking NPS with financial data

MRR (Monthly Recurring Revenue), as the name suggests, is the total revenue acquired by a SaaS business on a monthly basis. Since most SaaS companies have monthly subscription plans, growing the MRR is akin to growing the top line of the company.
MRR churn denotes the total revenue loss due to churn on a monthly basis. When Typeform segmented the MRR Churn based on the collected NPS data, they found that promoters churn less, while passives and detractors behave similarly.
The surprising insight, however, was that non-respondents churned the most. In fact, according to Typeform’s collected data, customers who gave a low score on the NPS survey were much less likely to churn than customers who didn’t respond at all.
To address the issue, Typeform looked at building up engagement with non-responsive customers, since these users had the highest probability of leaving.
Apart from knowing which customers to focus on, linking NPS with financial data also enabled Typeform to justify the cost of projects that will have a positive effect on their NPS.
For instance, if a successful implementation of a feature request led to more satisfied customers, it would reduce the churn rate, thereby increasing revenue and overall customer lifetime value.
Delivering Customer Success
Considering the fact that Typeform has over a million users, talking to every customer individually and knowing whether their product was delivering favorable outcomes to them was simply an impossible task.
According to David, the primary idea behind deploying NPS was to create a low-touch automated strategy that feels to the user like a high-touch personalized interaction. By combining the emotional response of users with their behavioral statistics, Typeform was able to establish a direct correlation between customer satisfaction and their NPS.
“NPS is a really powerful tool. With just two questions, you get qualitative as well as quantitative feedback. We use NPS data to design our product map, reach out to individual users who are slipping away, and to create educational material to better teach users how to use features which they might be confused about.”
David strongly believes that proactively eliciting customer insights holds the key to optimizing product experiences and deliver Customer Success. While Typeform uses multiple metrics to track Customer Success, NPS has become one of the most important business metrics for evaluating their product roadmap and boosting customer satisfaction to the next level.
Watch the Presentation
The original presentation is available here:
Start implementing Net Promoter Score today
Want to boost your customer satisfaction, get feedback on your product and increase revenue? Sign up for a Retently account and send your NPS survey right away. Our highly customizable NPS survey platform makes it easy to collect customer feedback, automate workflows, and improve overall customer satisfaction.
")

 Greg Raileanu

 Christina Sol
